You can download the full January–March 2018 QSM results (1.3 MB, PDF) or view the commentary and interactive charts below.
Falls
Nationally, 92 percent of older patients* were assessed on their falls risk in quarter 1, 2018. The rate has remained around the expected achievement level of 90 percent since quarter 4, 2013, in spite of some variations in a few quarters. At the district health board (DHB) level, 12 out of 20 DHBs achieved the expected marker level. Northland DHB is the only DHB to be in the lower group for risk assessments completed in the last three quarters. This is being followed up with the DHB to understand what is contributing to this result. Nelson Marlborough DHB had a fall of 23 percentage points, which is due to earlier data inadvertently auditing discharge rather than admission ward, which did not ensure assessments had been completed within 24 hours of admission. Hauora Tairāwhiti did not submit data this quarter, due to staff transitions.
Falls Tableau 1
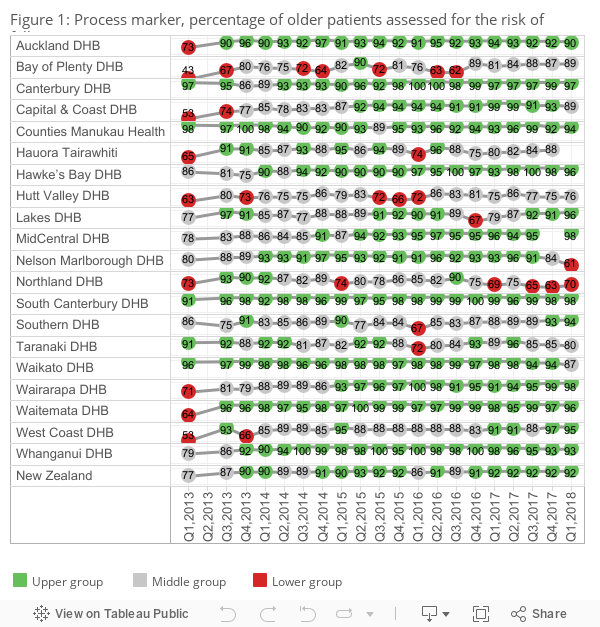
- Upper group: ≥ 90 percent
- Middle group: 75–89 percent
- Lower group: < 75 percent
* Patients aged 75+ (55+ for Māori and Pacific peoples)
About 93 percent of patients assessed as being at risk of falling had an individualised care plan completed. This measure has increased 16 percentage points compared with the baseline in quarter 1, 2013. Achievements at DHB level vary but, overall, where an individual has been assessed at risk of falling, completion of individualised care plans for that population group need to be at a consistently high level. We have on average 12 DHBs in the upper group. Hauora Tairāwhiti did not submit data this quarter, due to staff transitions.
Falls Tableau 2
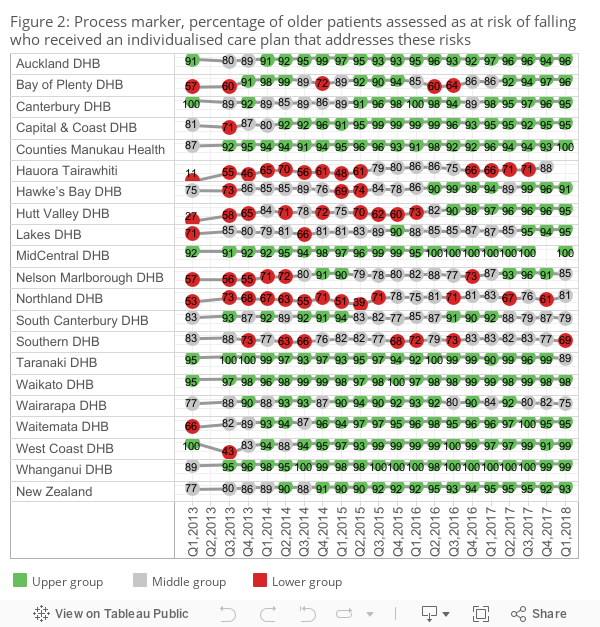
- Upper group: ≥ 90 percent
- Middle group: 75–89 percent
- Lower group: < 75 percent
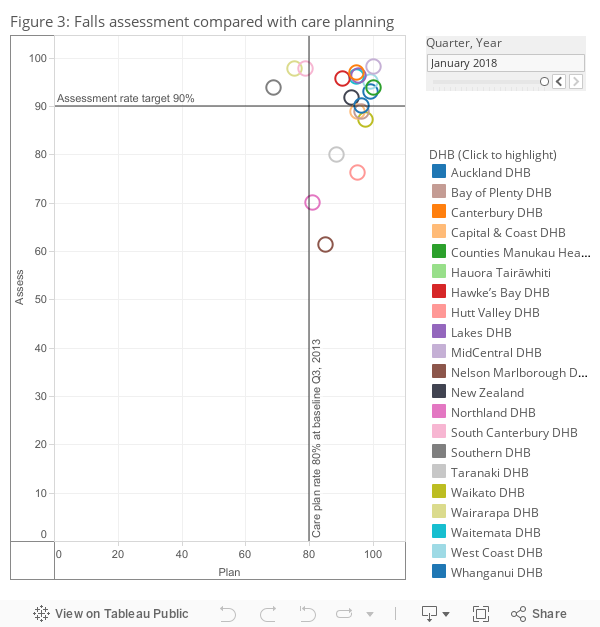
When assessments and care plans are plotted against each other, a trend of movement over time is shown from the bottom left corner (low assessment and individualised care plan) to the top right corner (high assessment and individualised care plan). Five DHBs sat at the top right corner in quarter 1, 2013; in the current quarter, 10 DHBs are in this ‘ideal’ box (see Figure 3), down from 12 in the last quarter.
Falls Tableau 3
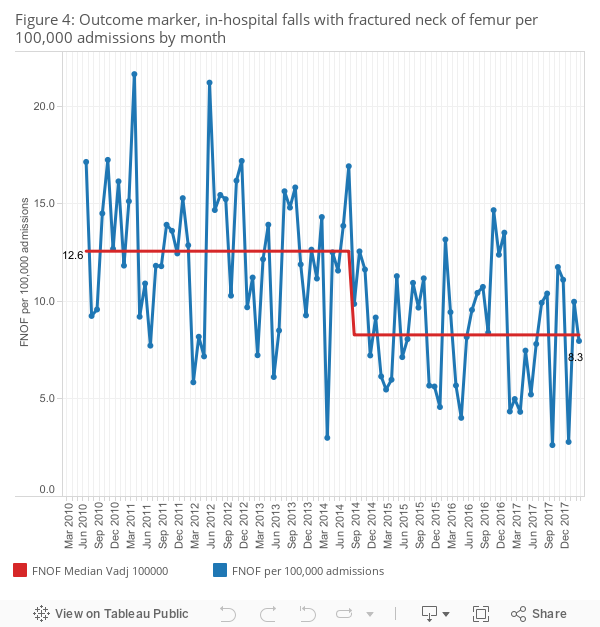
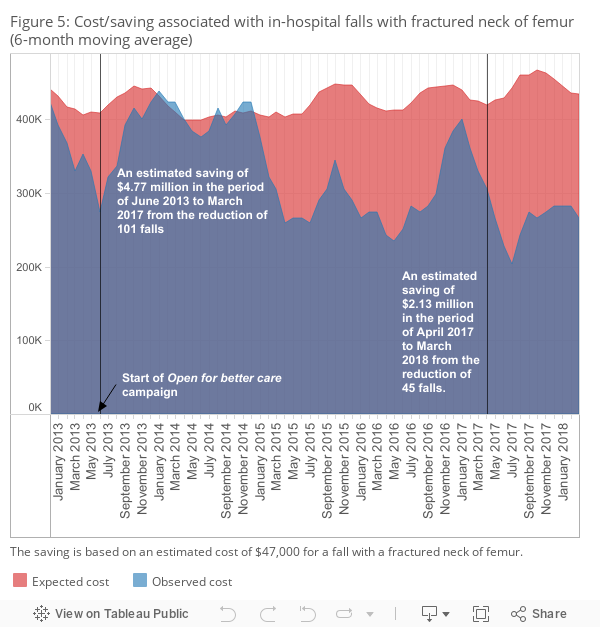
There were 69 falls resulting in a fractured neck of femur (broken hip) in the 12 months ending March 2018.
To control the impact of changes in the number of admissions per month, Figure 4 shows in-hospital falls causing a fractured neck of femur per 100,000 admissions. The median of this measure was 12.6 in the baseline period of July 2010 to June 2012. It has moved down since September 2014, to 8.4 per 100,000 admissions, and shown a significant improvement.
Falls Tableau 4
The number of 69 in-hospital falls resulting in a fractured neck of femur is significantly lower than the 114 we would have expected this year, given the falls rate observed in the period between July 2010 and June 2012. The reduction is estimated to have saved $2.13 million in the year ending March 2018, based on an estimate of $47,000[1] for a fall with a fractured neck of femur.
We know some of these patients are likely to be admitted to aged residential care on discharge from hospital, which is estimated to cost $135,000 each time it occurs.[2]
If we conservatively estimate that 20 percent of the patients who avoided a fall-related fractured neck of femur would have been admitted to a residential care facility, the reduction in falls represents $2.93 million in total avoidable costs since April 2017.
Falls Tableau 5
Hand Hygiene Tableau 1
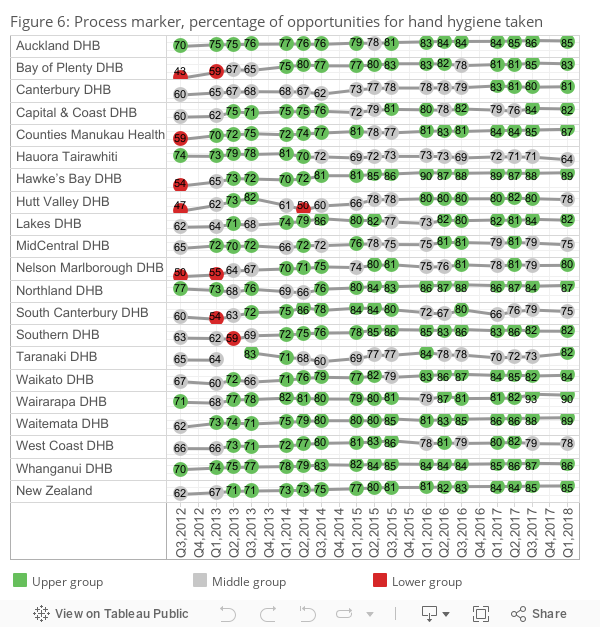
- Upper group: ≥ 70 percent before quarter 3, 2014, 75 percent in quarters 3 and 4, 2014, and 80 percent since quarter 1, 2015.
- Middle group: 60 percent to target.
- Lower group: < 60 percent.
- Hand hygiene national compliance data is reported three times every year; therefore, no data point is shown specifically for quarter 4 in any year.
The hand hygiene outcome marker is healthcare associated Staphylococcus aureus bacteraemia (SAB) per 1,000 bed-days. In quarter 2, 2017, the calculation method for the denominator changed so the definition for calculating DHB bed-days is applied consistently. Figure 7 (monthly healthcare associated SAB per 1,000 bed-days) displays the recalculation of the entire series using the new method. The latest quarter’s denominator is incomplete therefore the last month (March 2018) has been excluded from this update. The SAB outcome marker seems to be increasing despite improvements in hand hygiene compliance. SAB rates are complex and this increase could be due to social, environmental or economic determinants of health.
Hand hygiene tableau 2

Surgical site infection improvement (SSII) – orthopaedic surgery
As the Commission uses a 90–day outcome measure for surgical site infection (SSI), the data runs one quarter behind other measures. Information in this section relates to hip and knee arthroplasty procedures from quarter 3, 2013 to quarter 4, 2017.
During quarter 3, 2017, the SSII programme worked with DHBs to reconcile and review the historic programme data. This report reflects the changes made to historic data as a result. In December 2017, the group boundaries for the process markers changed to match the SSII programme reports.
Process marker 1: Antibiotic administered in the right time
For primary procedures, an antibiotic should be administered in the hour before the first incision (‘knife to skin’). As this should happen in all primary cases, the threshold is set at 100 percent. In quarter 4, 2017, 98 percent of hip and knee arthroplasty procedures involved the giving of an antibiotic within 60 minutes before knife to skin. Thirteen DHBs achieved the national goal. This is the highest number of DHBs achieving the goal historically.
SSI tableau 1
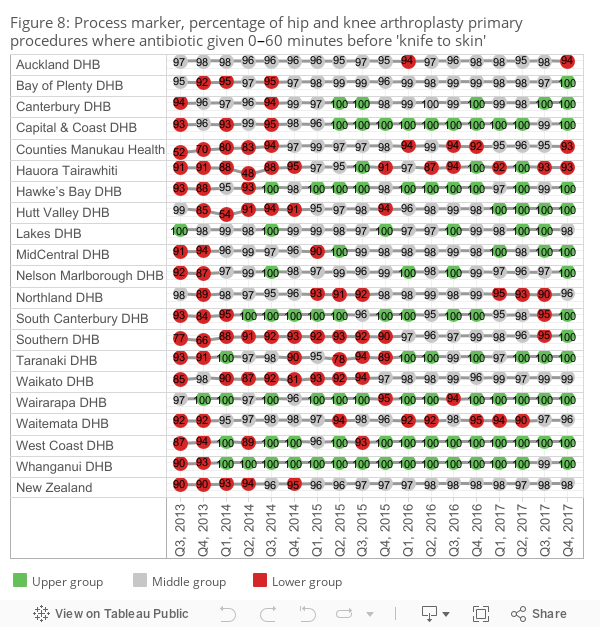
• Upper group: 100 percent
• Middle group: 95–99 percent
• Lower group: < 95 percent
Process marker 2: Right antibiotic in the right dose – cefazolin 2 g or more or cefuroxime 1.5 g or more
In the current quarter, 97 percent of hip and knee arthroplasty procedures received the recommended antibiotic and dose. Seventeen DHBs reached the threshold level of 95 percent compared with only three in the baseline quarter.[3]
SSI Tableau 2
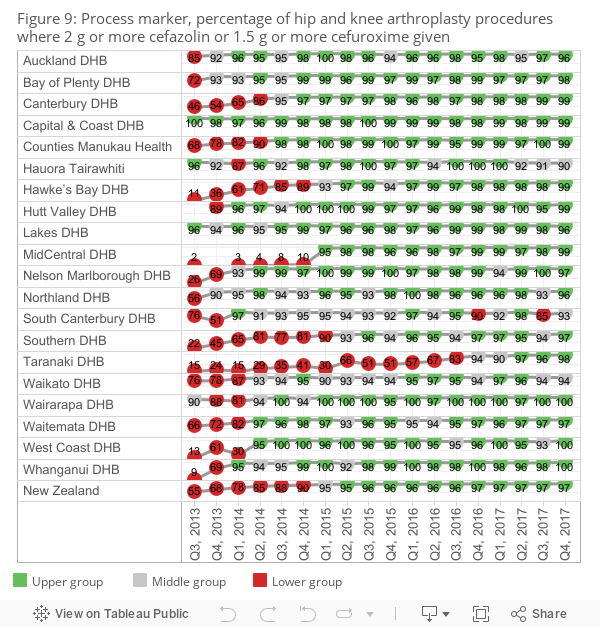
Upper group: ≥ 95 percent
• Middle group: 90–94 percent
• Lower group: < 90 percent
Outcome marker
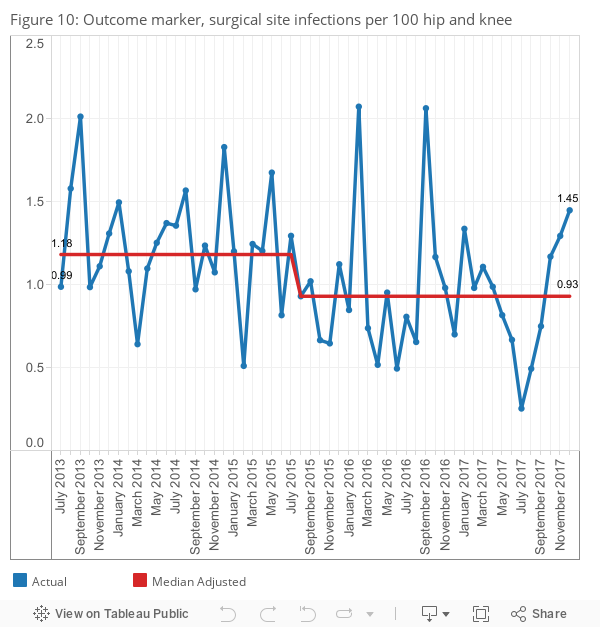
The outcome marker is surgical site infections (SSIs) per 100 hip and knee operations. Previous reports had a 12-month baseline period beginning March 2013. Recent work to reconcile and review the historic programme data showed considerable variation in data quality in the first four months’ worth of data collected. Since December 2017, we have excluded the months March to June 2013 from our analysis. July 2013 was the point at which all 20 DHBs were participating in the SSII programme. The effects of this recalculation are minimal. A shift in the median is detected from August 2015 with the reduction being from 1.18 percent SSIs during the baseline period to 0.93 percent following it.
During the reduction period, there are spikes in February and September 2016. Examination of the September DHB-level data shows the number of SSIs increased by one or two cases in seven DHBs compared with their baseline levels of zero or one case per month. Figures in both February and September 2016 are higher outliers. They indicate some one-time occurrences of special cause variation. Since July 2017 the percentage of SSIs has increased every month, which may give an early indication of an upward shift. This occurred after the lowest ever recorded percentage of operations which had an SSI.
SSI Tableau 3
Surgical site infection – cardiac surgery
This is the sixth quality and safety marker (QSM) report for cardiac surgery. Since quarter 3, 2016, all five DHBs performing cardiac surgery have submitted process and outcome marker data from all cardiac surgery procedures, including coronary artery bypass graft with both chest and donor site and with chest site only. There are three process markers and one outcome marker, which are similar to the QSMs for orthopaedic surgery.
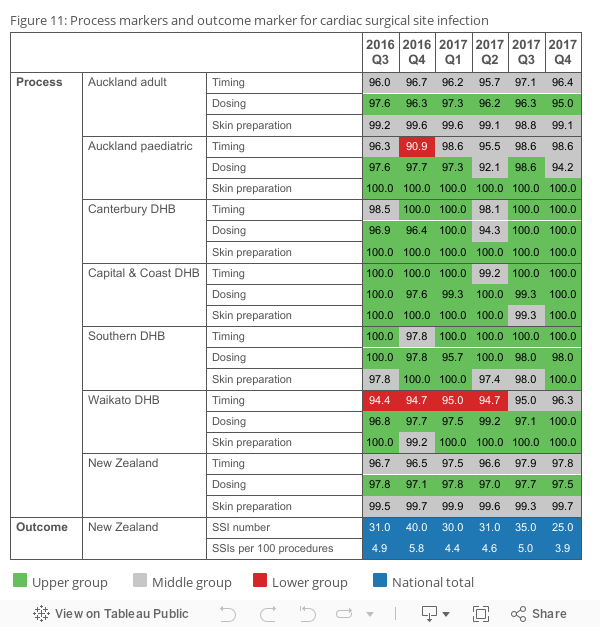
Process marker 1 is ‘timing’, which requires an antibiotic to be given 0–60 minutes before knife to skin. The target is 100 percent of procedures achieving this marker. Canterbury, Capital & Coast and Southern DHBs all achieved the target this quarter.
Process marker 2 is ‘dosing’, which requires the antibiotic prophylaxis of choice to be ≥ 2 g or more of cefazolin for adults and ≥ 30 mg/kg of cefazolin for paediatric patients, not to exceed the adult dose. The target is that either dose is used in at least 95 percent of procedures. All DHBs, except Auckland paediatric achieved the target this quarter.
Process marker 3 is ‘skin preparation’, which requires use of an appropriate skin antisepsis in surgery using alcohol/chlorhexidine or alcohol/povidone iodine. The target is 100 percent of procedures achieving this marker. All DHBs, except Auckland adult achieved the target this quarter.
The outcome marker is SSIs per 100 procedures rate. In quarter 4, 2018, there were 25 SSI in 641 procedures, an infection rate of 3.9 percent. This is the lowest recorded rate and is one percentage point lower than the previous quarter and the baseline quarter, with respective rates of 5 percent and 4.9 percent.
SSI CS Tableau 1
Safe surgery
This is the seventh report for the safe surgery QSM, which measures levels of teamwork and communication around the paperless surgical safety checklist.
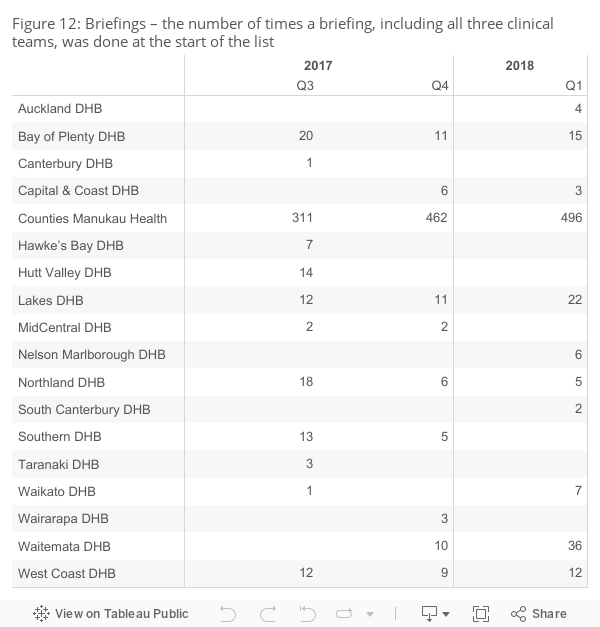
The safe surgery QSM now includes a start-of-list briefing measure, to reinforce the importance of the briefing as a safe surgery intervention. The measure is described as ‘Was a briefing including all three clinical teams done at the start of the list?’.
Figure 12 shows, in quarter 1, 2018, 11 DHBs reported this was happening. There is no specific target for this part of the measure; the aim is to have all 20 DHBs increasingly undertaking and reporting briefings over time. The programme team will work with the auditing teams to increase data collection so that the report better matches practice in DHBs.
Note: Data not submitted for Hauora Tairāwhiti and Whanganui DHB.
Safe surgery tableau 1
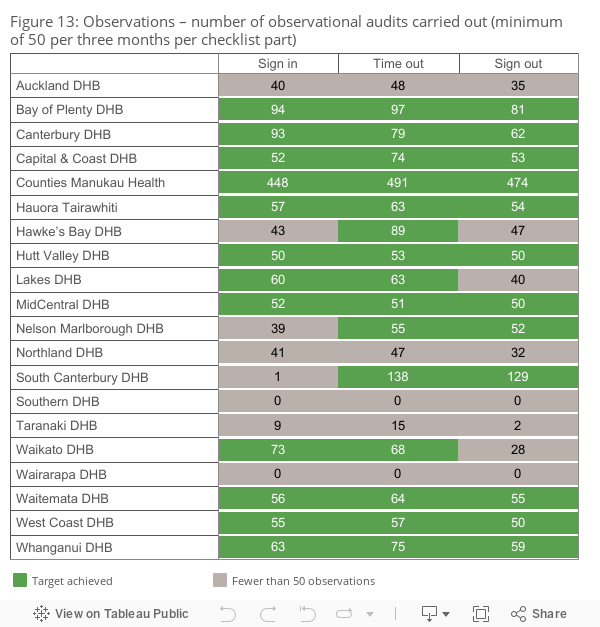
Direct observational audit was used to assess the use of the three surgical checklist parts: sign in, time out and sign out. A minimum of 50 observational audits per quarter per part is required before the observation is included in uptake and engagement assessments. Rates are greyed out in the tables below where there were fewer than 50 audits.
Figure 13 shows, for each part of the checklist, how many audits were undertaken. Ten out of the 20 DHBs achieved 50 audits for all three parts in quarter 1, 2018. Southern and Wairarapa DHBs are not presented as their data was not available.
Safe surgery tableau 2
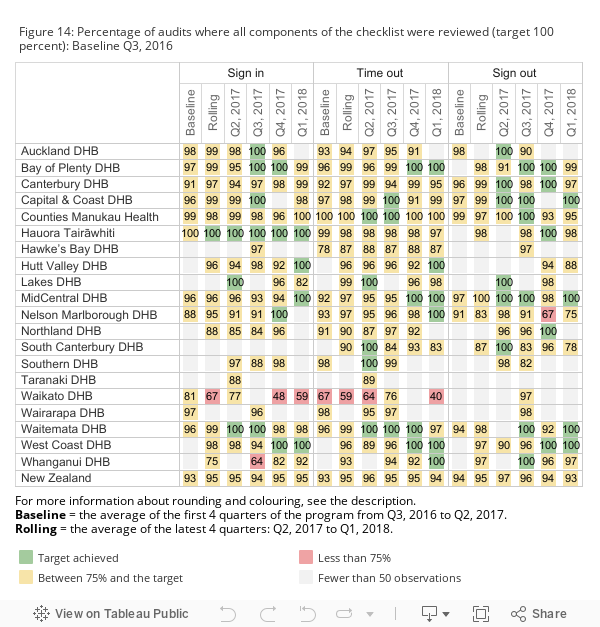
Rates for uptake (all components of the checklist were reviewed by the surgical team) are only presented where at least 50 audits were undertaken for a checklist part. Uptake rates were calculated by measuring the number of audits of a part where all components of the checklist were reviewed against the total number of audits undertaken. The components for each part of the checklist are shown in the poster on the right. Of the 10 DHBs that achieved 50 audits in each checklist, nine achieved the 100 percent uptake target in at least one part of the checklist, during the current quarter (see Figure 14). Data is not presented where there were fewer than 50 audits.
Sign out has had a four percent decrease nationally since quarter 2, 2017. This is due to the denominator being low in quarter 2, 2017 while the numerator remained stable.
Safe surgery tableau 3
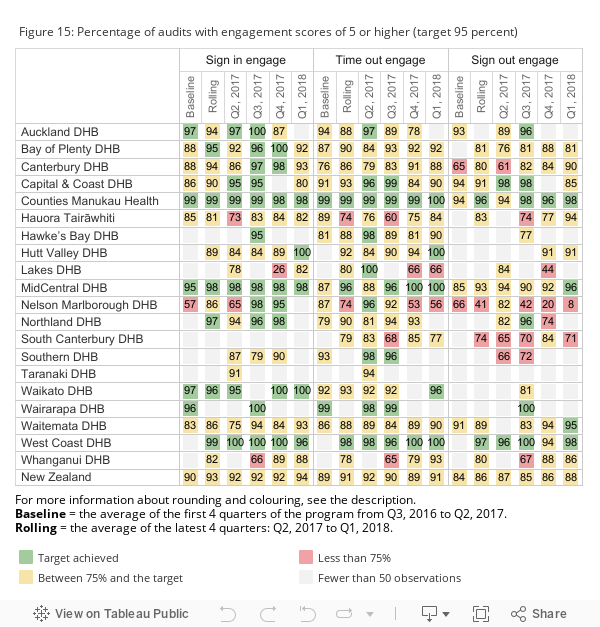
The levels of team engagement with each part of the checklist were scored using a seven-point Likert scale developed by the World Health Organization. A score of 1 represents poor engagement from the team and 7 means team engagement was excellent. The target is that 95 percent of surgical procedures score engagement levels of 5 or above. As Figure 15 shows, for the latest quarter, Counties Manukau Health, MidCentral and West Coast DHBs achieved the target in all three parts and three other DHBs achieved the target in one or two parts. Data is not presented where audits were fewer than 50. As this is only the seventh quarter in which DHBs have measured the impact of the safe surgery programme, the focus is still on embedding the programme and the auditing method. Better results are expected in subsequent quarters.
Note: the numbers in Figures 14 and 15 have been rounded but the colours are assigned based on whether the target was achieved.
Safe surgery tableau 4
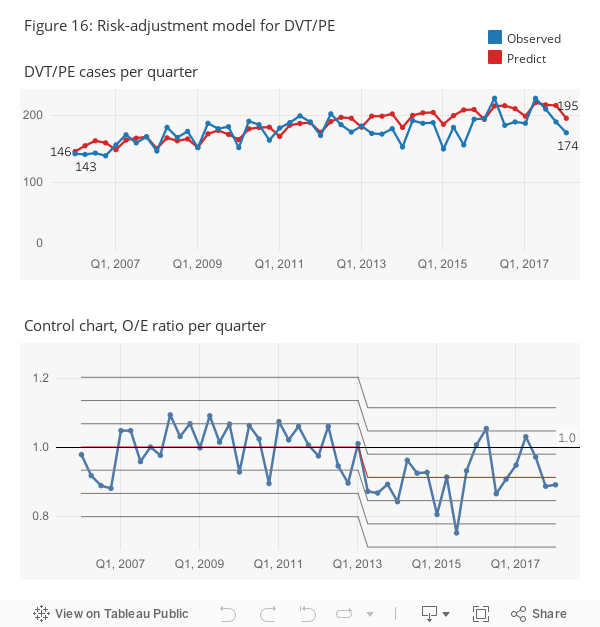
The rates for postoperative sepsis and deep vein thrombosis/pulmonary embolism (DVT/PE) are the two outcome markers for safe surgery. The rates have fluctuated over time. To understand the factors driving the changes and to provide risk-adjusted outcomes in the monitoring and improvement of surgical QSMs, we have developed a risk-adjustment model for these two outcome measures.
The model is used to identify how likely patients being operated on were to develop sepsis or DVT/PE based on factors such as their conditions, health history and the operation being undertaken. From this, we can calculate how many patients we would have predicted to develop sepsis or DVT/PE based on historic trends. We can then compare how many actually did develop sepsis or DVT/PE, to create an observed/expected (O/E) ratio. If the O/E ratio is more than 1 then there are more sepsis or DVT/PE cases than expected, even when patient risk is taken into account. A ratio of less than 1 indicates fewer sepsis or DVT/PE cases than expected.
We are currently reviewing and analysing the definition of postoperative sepsis, we will update the O/E ratio charts in the next quarter’s report.
Figure 16 shows the DVT/PE risk-adjustment model results in two charts. Using the same methodology as above, the O/E ratio control chart shows there were 11 consecutive quarters in which the observed numbers were below the expected numbers since quarter 2, 2013. This indicates a statistically significant downwards shift, taking into account the increasing number of high-risk patients treated by hospitals and more complex procedures undertaken by hospitals.
Safe surgery tableau 5
Medication safety
The QSM for medication safety focuses on medicine reconciliation. This is a process by which health professionals accurately document all medicines a patient is taking and their adverse reactions history (including allergy). The information is then used during the patient’s transitions in care. An accurate medicines list can be reviewed to check the medicines are appropriate and safe. Medicines that should be continued, stopped or temporarily stopped can be documented on the list. Reconciliation reduces the risk of medicines being:
- omitted
- prescribed at the wrong dose
- prescribed to a patient who is allergic
- prescribed when they have the potential to interact with other prescribed medicines.
The introduction of electronic medicine reconciliation (eMedRec) allows reconciliation to be done more routinely, including at discharge. There is a national programme to roll out eMedRec throughout the country; Figure 17 shows there are five DHBs that have implemented the system to date. Further uptake of eMedRec is limited until the IT infrastructure is improved in each DHB hospital.

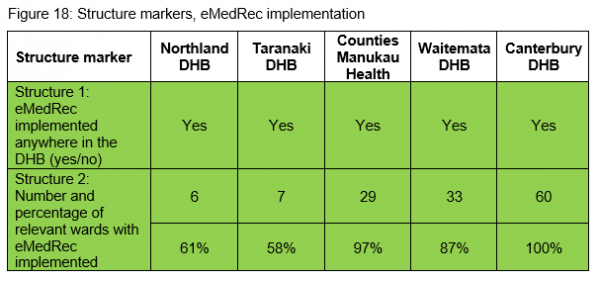
Within the five DHBs that have implemented eMedRec, only Northland and Taranaki DHBs reported process markers. Figure 19 shows the process marker change overtime for these two DHBs.
Medication safety tableau 1

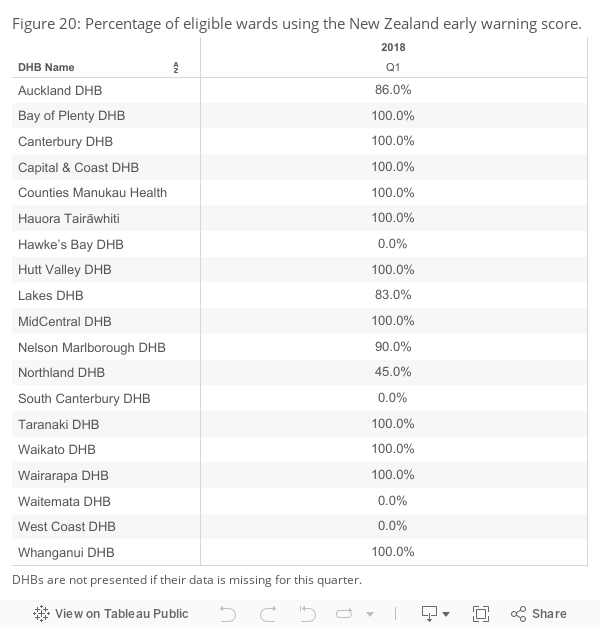
This is the first time DHBs have submitted data for the patient deterioration QSM. The structural measure demonstrates the progress that DHBs have made towards implementing improvements to their recognition and response systems as at 31 March 2018.
The majority of DHBs (75 percent) have implemented or are in the process of implementing the New Zealand early warning score into their hospitals. This has been done through changing to the national vital signs chart or having the New Zealand early warning score within their electronic vital signs system.
Patient deterioration tableau 1
Local DHB report
References:
- de Raad J–P. 2012. Towards a value proposition: scoping the cost of falls. Wellington: NZIER.
- Ibid.
- In quarter 1, 2015, 1.5 g or more of cefuroxime was accepted as an alternative agent to 2 g or more of cefazolin for routine antibiotic prophylaxis for hip and knee replacements. This improved the results of this process measure for MidCentral DHB significantly, from 10 percent before the change to 96 percent immediately after the change. It also increased the national result from 90 percent to 95 percent in quarter 1, 2015.
Last updated: 12th November, 2021