You can download the full July–September 2019 QSM results (2.5MB, PDF) or view the commentary and interactive charts below.
Local DHB Report
Falls
Process marker 1: Percentage of older people assessed for the risk of falling
Nationally, 89 percent of older patients* were assessed for their falls risk in quarter 3, 2019 (Figure 1). This marker has dropped below the expected achievement level of 90 percent for the last three quarters. Prior to this, the target was achieved most quarters since quarter 4, 2013.
At the district health board (DHB) level, 12 out of 20 DHBs achieved the expected marker level for this current quarter; seven of them have remained at this level for at least six continuous quarters. Hutt Valley, Northland and Taranaki DHBs have consistently not met the expected marker level since quarter 4, 2012. Nelson Marlborough DHB has been consistently lower than the national rate in the assessment for the risk of falling from quarter 4, 2017.
Falls T 1
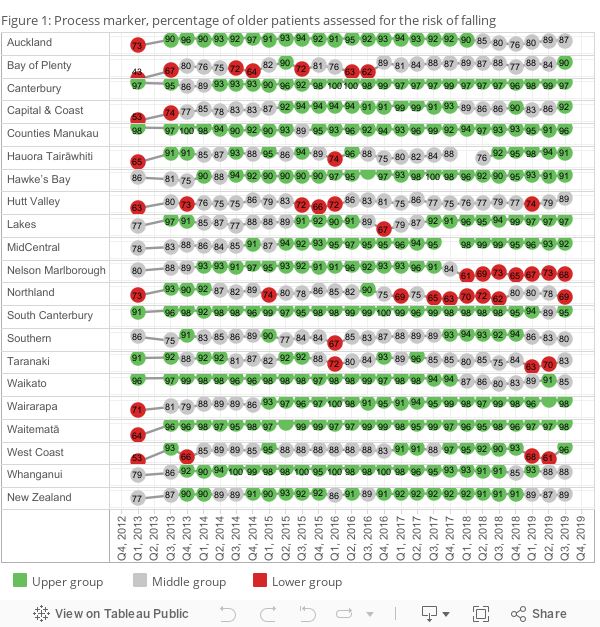
- Upper group: ≥ 90 percent
- Middle group: 75–89 percent
- Lower group: < 75 percent
* Patients aged 75+ (55+ for Māori and Pacific peoples)
Process marker 2: Percentage of older people assessed as at risk of falling who received an individualised care plan that addresses these risks
About 90 percent of patients assessed as being at risk of falling had an individualised care plan completed (Figure 2). This measure has increased 13 percentage points compared with the baseline in quarter 1, 2013. Achievements vary across DHBs. In quarter 3, 2019, there were 15 DHBs in the upper group compared with 16 in quarter 2, 2019. South Canterbury and Southern DHBs have been consistently lower than the national rate in the development of an individualised care plan. Northland has remained in the upper group since quarter 3, 2018 and Hauora Tairāwhiti has since quarter 4. Six DHBs have been present in the upper group for the most recent six quarters.
Falls T 2
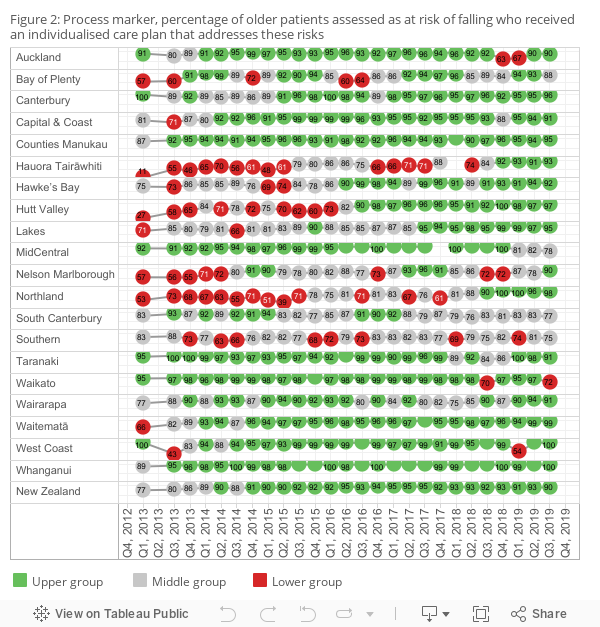
- Upper group: ≥ 90 percent
- Middle group: 75–89 percent
- Lower group: < 75 percent
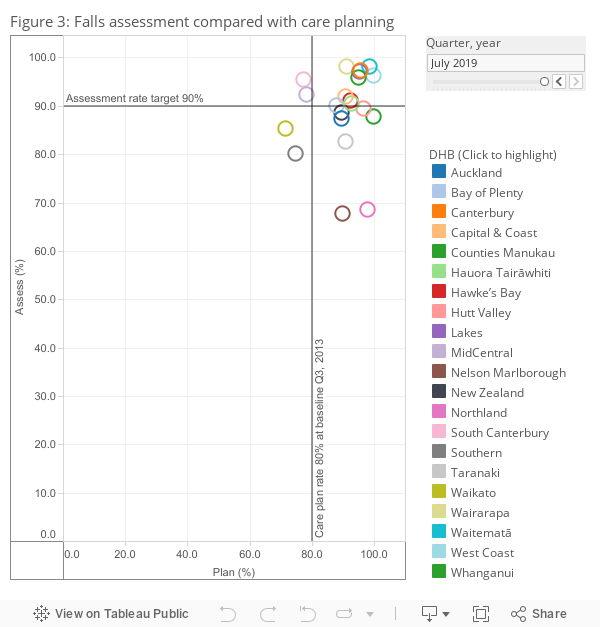
When assessments and care plans are plotted against each other, a trend of movement over time is shown from the bottom left corner (low assessment and individualised care plan) to the top right corner (high assessment and individualised care plan) in Figure 3. Five DHBs sat at the top right corner in quarter 1, 2013; in quarter 3, 2019, nine DHBs are in this ‘ideal’ box (see Figure 3), the same as the last quarter.
Falls T 3
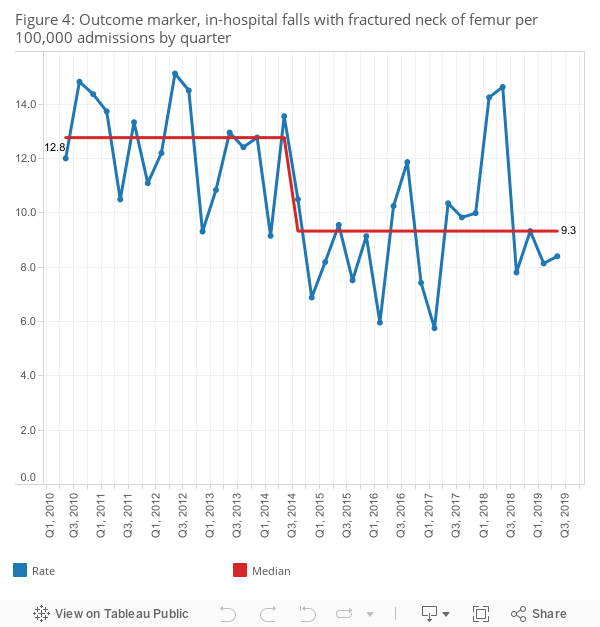
Outcome marker: In-hospital falls resulting in a fractured neck of femur per 100,000 admissions
There were 87 falls resulting in a fractured neck of femur (broken hip) in the 12 months ending September 2019.
To control the impact of changes in the number of admissions and to capture special causes of variation with a more robust time-series, the results will be reported quarterly instead of monthly. Figure 4 shows the quarterly rate of in-hospital falls causing a fractured neck of femur per 100,000 admissions.
The median of this measure was 12.8 in the baseline period of July 2010 to June 2012. It had moved down since September 2014, to 9.3 per 100,000 admissions, and shown a significant improvement. This reduction is supported by the observed improvement in the assessment and plan process markers results. There is some variation since the shift, especially in 2018. Further analysis is needed to understand the causes of the variations.
Falls T 4
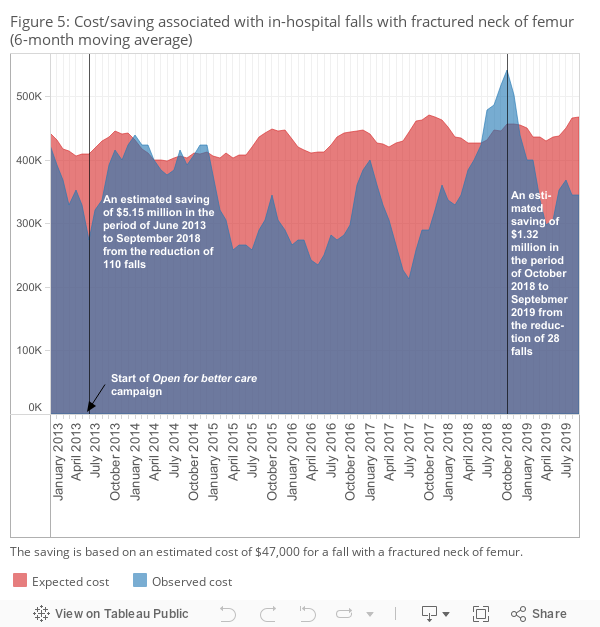
The number of 87 in-hospital falls resulting in a fractured neck of femur is significantly lower than the 115 we would have expected this year, given the falls rate observed in the period between July 2010 and June 2012. The in-hospital falls reduction is estimated to have saved $1.32 million from October 2018 up until September 2019. This is based on an estimate of $47,000 [1] for a fall with a fractured neck of femur (Figure 5).
We know some of these patients are likely to be admitted to aged residential care on discharge from hospital, which is estimated to cost $135,000 per occurrence. [2]
If we conservatively estimate that 20 percent of the patients who avoided a fall-related fractured neck of femur would have been admitted to an aged residential care facility, the reduction in falls represents $1.82 million in total avoidable costs since October 2018.
Falls T 5
Hand hygiene
Process marker 1: Percentage of opportunities for hand hygiene taken
National compliance with the five moments for hand hygiene remains high. Nationally, DHBs maintained an average of 85 percent compliance for the period July–October 2019 compared with 62 percent in the baseline in July–October 2012. Hauora Tairāwhiti and Taranaki DHB have been consistently below the national target of 80 percent.
HH T 1
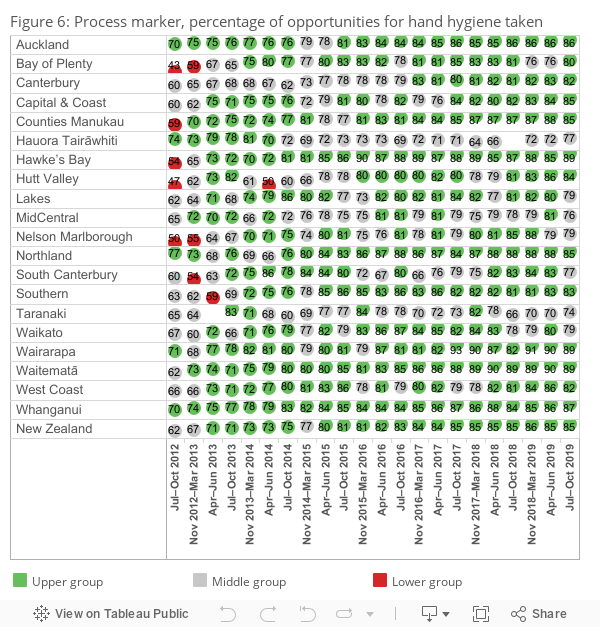
- Upper group: ≥ 70 percent before quarter 3, 2014, 75 percent in quarters 3 and 4, 2014, and 80 percent since quarter 1, 2015.
- Middle group: 60 percent to target.
- Lower group: < 60 percent.
- Hand hygiene national compliance data is reported three times every year, not quarterly.
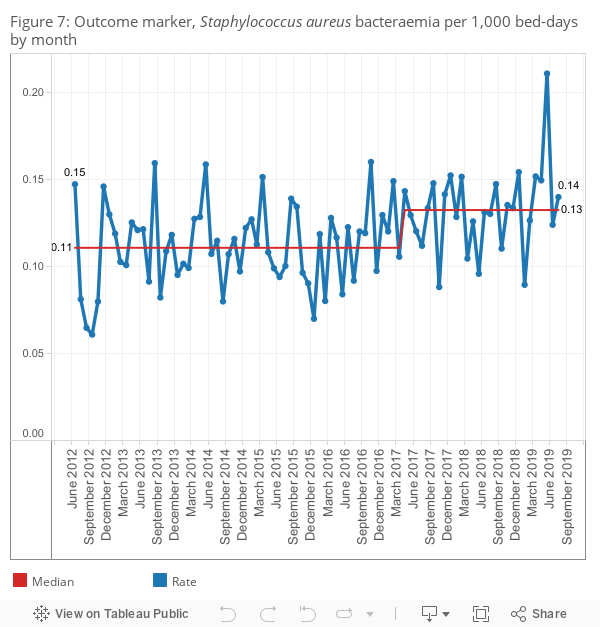
Outcome marker: Healthcare associated Staphylococcus aureus bacteraemia (SAB) per 1,000 bed-days
Healthcare associated SAB can be associated with medical devices or surgical procedures which means the onset of symptoms may occur outside of the hospital (community onset).
Figure 7 displays the monthly healthcare associated SAB per 1,000 bed-days. Data for the last month, September, is omitted, due to denominator completeness issues. From May 2017, the median has increased from 0.11 to 0.13 per 1,000 bed-days. This is a statistically significant shift. We are working with DHBs to better understand this and will monitor closely in the coming quarters. The rate was at its highest in June 2019 at 0.21.
HH T 2
Surgical site infection improvement (SSII) – orthopaedic surgery
As the Commission uses a 90-day outcome measure for surgical site infection (SSI), the data runs one quarter behind other measures. Information in this section relates to hip and knee arthroplasty procedures from quarter 3, 2013 to quarter 2, 2019.
Process marker 1: Antibiotic administered in the right time
For primary procedures, an antibiotic should be administered in the hour before the first incision (‘knife to skin’). As this should happen in all primary cases, the threshold is set at 100 percent. In quarter 2, 2019, 97 percent of hip and knee arthroplasty procedures involved the giving of an antibiotic within 60 minutes before knife to skin. Ten DHBs achieved the national goal. Counties Manukau, Northland and Waitematā DHBs have consistently been below the upper group since quarter 3, 2013.
SSII OS T 1
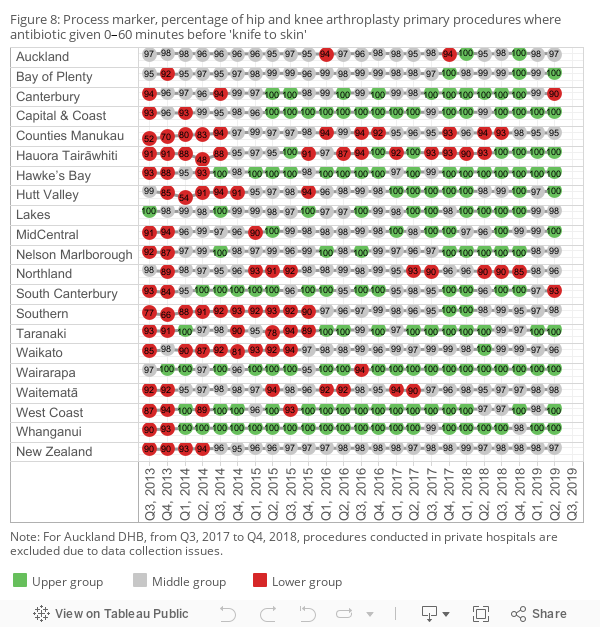
- Upper group: 100 percent
- Middle group: 95–99 percent
- Lower group: < 95 percent
Process marker 2: Right antibiotic in the right dose – cefazolin 2 g or more or cefuroxime 1.5 g or more
In the current quarter, 98 percent of hip and knee arthroplasty procedures received the recommended antibiotic and dose. Eighteen of the 20 DHBs reached the threshold level of 95 percent compared with only three in the baseline quarter. [3]
SSII OS T 2
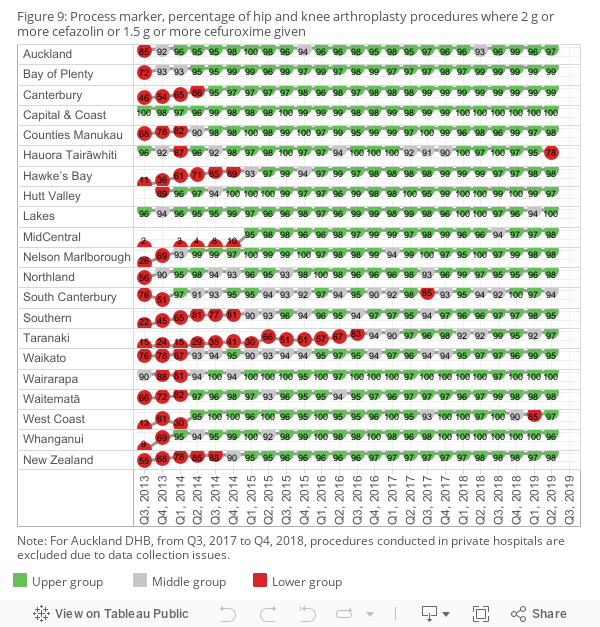
- Upper group: ≥ 95 percent
- Middle group: 90–94 percent
- Lower group: < 90 percent
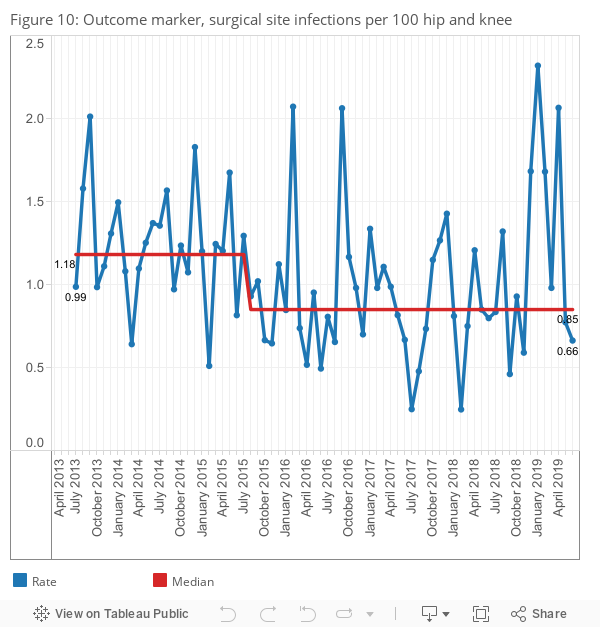
Outcome marker: SSIs per 100 hip and knee operations
In quarter 2, 2019, there were 30 SSIs out of 2,717 hip and knee arthroplasty procedures, a quarterly SSI rate of 1.10 percent, which is higher than the current median of 0.85 percent since August 2015. There were five consecutive points above the median since December 2018 and a peak rate of 2.32 percent in January 2019. This high rate was seen consistently across the country. We will monitor this closely in the coming quarters.
SSII OS T 3
Surgical site infection improvement (SSII) – cardiac surgery
This is the 11th quality and safety marker (QSM) report for cardiac surgery. Since quarter 3, 2016 all five DHBs performing cardiac surgery have submitted process and outcome marker data from all cardiac surgery procedures, including coronary artery bypass graft with both chest and donor site, and with chest site only. There are three process markers and one outcome marker, which are similar to the markers for orthopaedic surgery.
Process marker 1: Timing – an antibiotic to be given 0–60 minutes before knife to skin
The target is for 100 percent of procedures to achieve this marker. Auckland DHB paediatric achieved the target this quarter and Southern DHB has continued to meet the target for four successive quarters.
SSII CS T 1
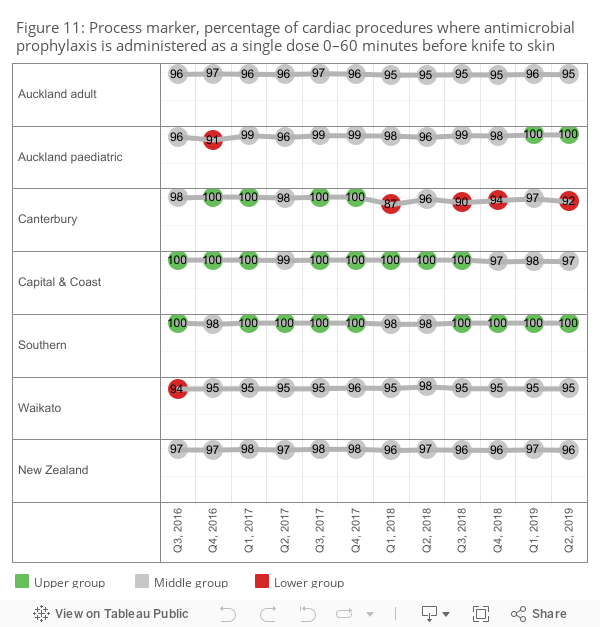
- Upper group: 100 percent
- Middle group: 95–99 percent
- Lower group: < 95 percent
Process marker 2: Dosing – correct antimicrobial prophylaxis used in at least 95 percent of procedures
The antibiotic prophylaxis of choice is ≥ 2 g or more of cefazolin for adults and ≥ 30 mg/kg of cefazolin for paediatric patients, not to exceed the adult dose. The target is that either dose is used in at least 95 percent of procedures. All DHBs performing cardiac surgery except Auckland paediatric achieved the target this quarter.
SSII CS T 2
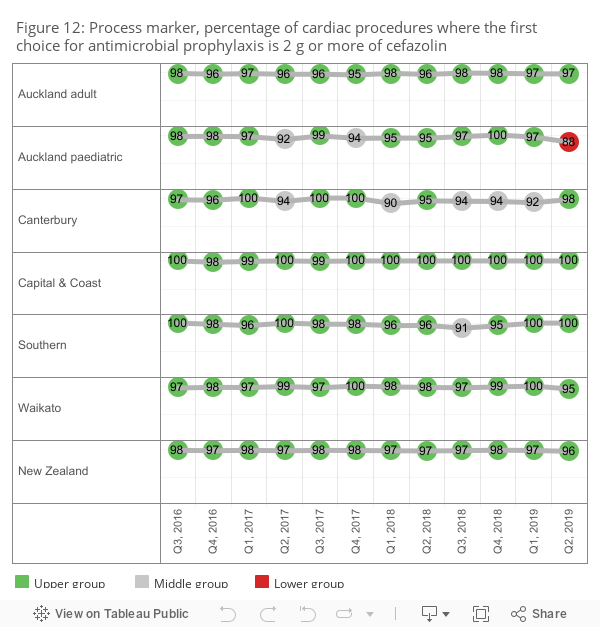
- Upper group: > 95 percent
- Middle group: 90-95 percent
- Lower group: < 90 percent
Process marker 3: Skin preparation – appropriate skin antisepsis is always used
Appropriate skin antisepsis in surgery involves alcohol/chlorhexidine or alcohol/povidone iodine. The target is 100 percent of procedures achieving this marker. Only Southern DHB did not meet the target this quarter.
SSII CS T 3
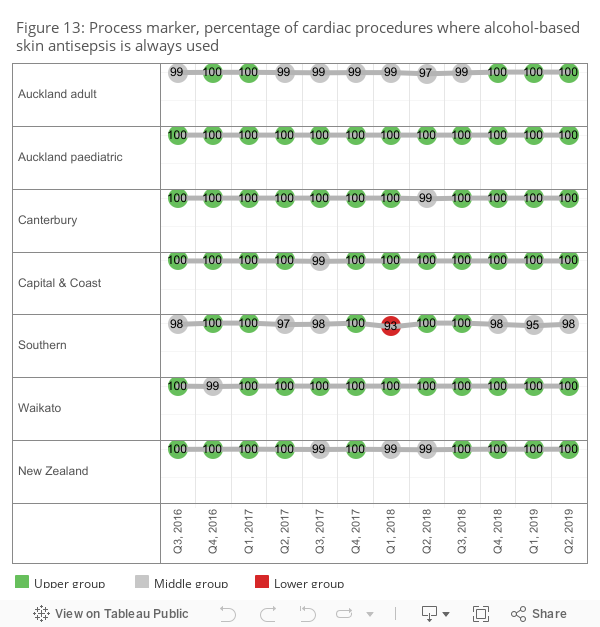
- Upper group: 100 percent
- Middle group: 95–99 percent
- Lower group: < 95 percent
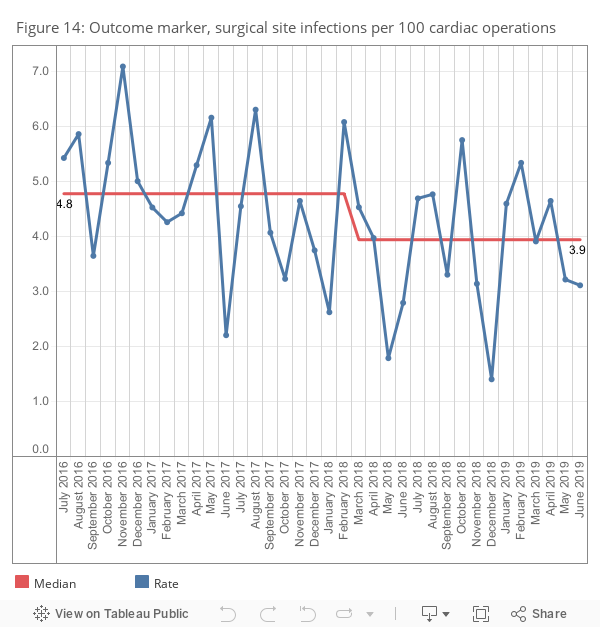
Outcome marker: SSIs per 100 procedures rate
In March 2018 we see the median shift downwards from 4.8 SSI cases per 100 cardiac procedures to 3.9. This is a significant improvement since the beginning of the Surgical Site Infection Improvement Programme.Cardiac surgical services in DHBs are dedicated to ensuring high compliance with the process measures and implementing other quality improvement activities such as an anti-staphylococcus bundle.
SSII CS T 4
Safe surgery
The safe surgery QSM measures levels of teamwork and communication relating to the paperless surgical safety checklist.
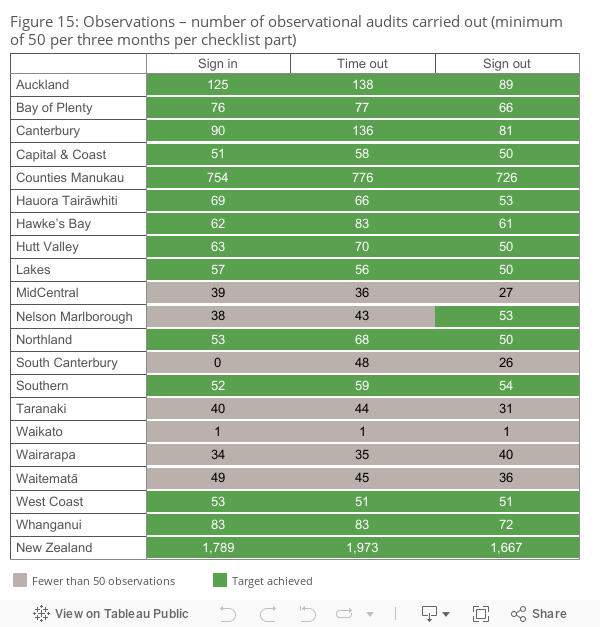
Direct observational audit was used to assess the use of the three surgical checklist parts: sign in, time out and sign out. A minimum of 50 observational audits per quarter per part is required before the observation is included in uptake and engagement assessments. Rates are greyed out in the tables below where there were fewer than 50 audits.
Figure 15 shows how many audits were undertaken for each part of the checklist. Fourteen out of the 20 DHBs achieved 50 audits for all three parts in quarter 3, 2019. Counties Manukau Health has a large auditor cohort, which explains its high numbers.
SS T 1
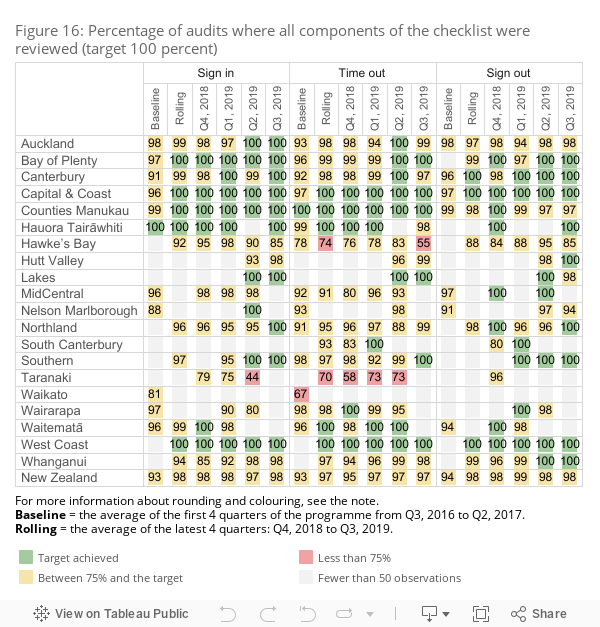
Rates for uptake (all components of the checklist were reviewed by the surgical team) are only presented where at least 50 audits were undertaken for a checklist part. Uptake rates were calculated by measuring the number of audits of a part where all components of the checklist were reviewed against the total number of audits undertaken.
The components for each part of the checklist are shown in the poster on the right. Of the 14 DHBs that achieved 50 audits in each checklist, 12 achieved the 100 percent uptake target in at least one part of the checklist, during the current quarter (see Figure 16). Data is not presented where there were fewer than 50 audits.
SS T 2
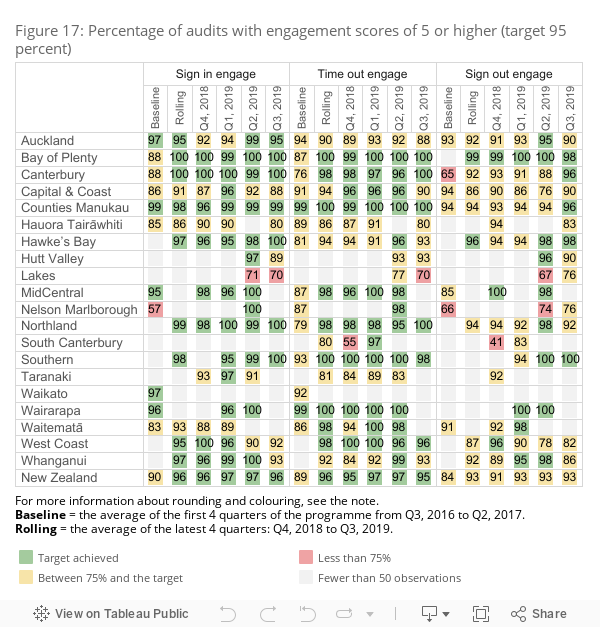
The levels of team engagement with each part of the checklist were scored using a seven-point Likert scale developed by the World Health Organization. A score of 1 represents poor engagement from the team and 7 means team engagement was excellent. The target is that 95 percent of surgical procedures score engagement levels of 5 or above. As Figure 17 shows, for the latest quarter, Bay of Plenty, Canterbury, Counties Manukau and Southern DHBs achieved the target in all three parts. Four other DHBs achieved the target in one or two parts, a decrease from eight DHBs last quarter. Data is not presented where there were fewer than 50 audits.
SS T 3
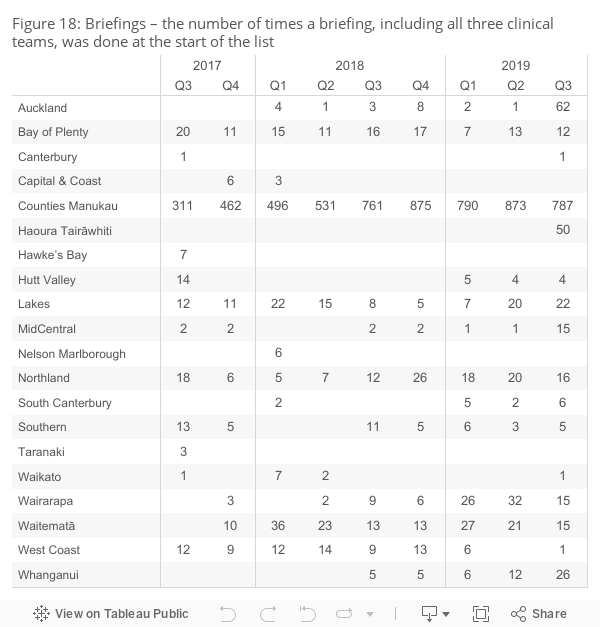
The safe surgery quality and safety domain includes a start-of-list briefing measure to reinforce the importance of the briefing as a safe surgery intervention. The measure is described as ‘Was a briefing including all three clinical teams done at the start of the list?’ There is no specific target for this part of the measure; the aim is to have all 20 DHBs increasingly undertaking and reporting briefings over time.
Figure 18 shows, in quarter 3, 2019, 16 DHBs reported that a start-of-list briefing was happening. There has been a general increase observed over time. The Safe Surgery NZ programme team continues to work with the auditing teams to promote briefings and improve data submission so the report better matches practice in DHBs.
SS T 4
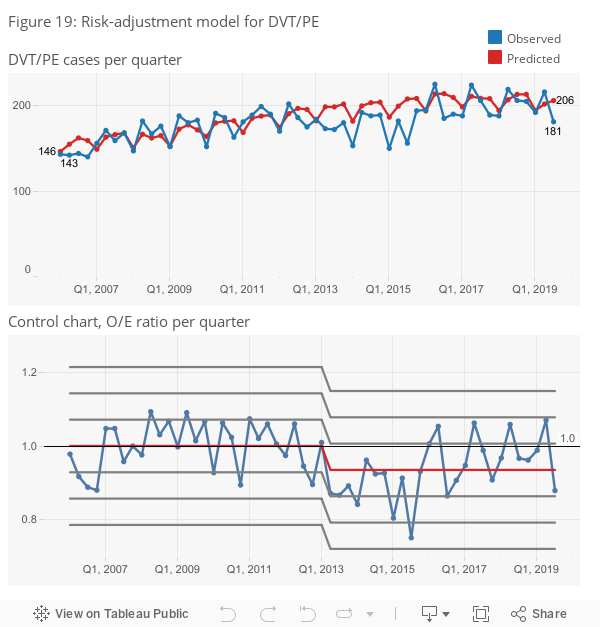
The rates of postoperative sepsis and deep vein thrombosis/pulmonary embolism (DVT/PE) are the two outcome markers for safe surgery. The rates have fluctuated over time. To understand the factors driving the changes and to provide risk-adjusted outcomes in the monitoring and improvement of surgical QSMs, we have developed a risk-adjustment model for these two outcome markers.
The model identifies how likely patients being operated on were to develop sepsis or DVT/PE based on factors such as their condition, health history and the operation being undertaken. From this, we calculated how many patients would be predicted to develop sepsis or DVT/PE based on historic trends. We then compare how many patients actually developed sepsis or DVT/PE to create an observed/expected (O/E) ratio. If the O/E ratio is more than 1 then there are more sepsis or DVT/PE cases than expected, even when patient risk is taken into account. A ratio of less than 1 indicates fewer sepsis or DVT/PE cases than expected.
Figure 19 shows the DVT/PE risk-adjustment model results in two charts. The O/E ratio control chart shows there were 11 consecutive quarters in which the observed numbers were below the expected numbers since quarter 2, 2013. This indicates a statistically significant downwards shift, taking into account the increasing number of high-risk patients treated by hospitals and more complex procedures undertaken by hospitals. Over the past three years, a higher number of cases of DVT/PE have been observed in the second quarter.
SS T 5
Medication safety – electronic medicine reconciliation
This quality and safety domain focuses on medicine reconciliation where the process is supported with electronic data capture. Medicine reconciliation is a process by which health professionals accurately document all medicines a patient is taking and their adverse reactions history (including allergy). The information is then used during the patient’s transitions in care. An accurate medicines list can be reviewed to check the medicines are appropriate and safe. Medicines that should be continued, stopped or temporarily stopped can be documented on the list. Reconciliation reduces the risk of medicines being:
- omitted
- prescribed at the wrong dose
- prescribed to a patient who is allergic
- prescribed when they have the potential to interact with other prescribed medicines.
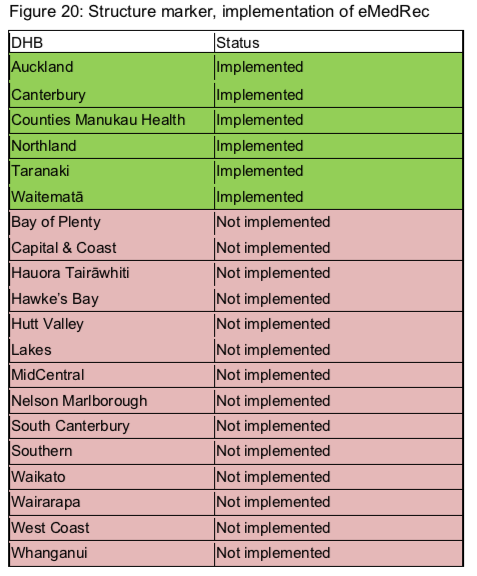
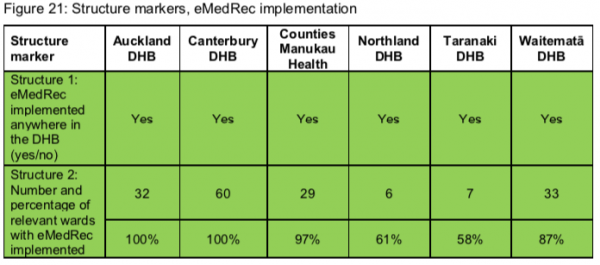
The introduction of electronic medicine reconciliation (eMedRec) allows reconciliation to be done more routinely, including at discharge. There is a national programme to roll out eMedRec throughout the country. Figures 20 and 21 show there are six DHBs that have implemented the system to date. Further uptake of eMedRec is limited until the IT infrastructure is improved in each DHB hospital.
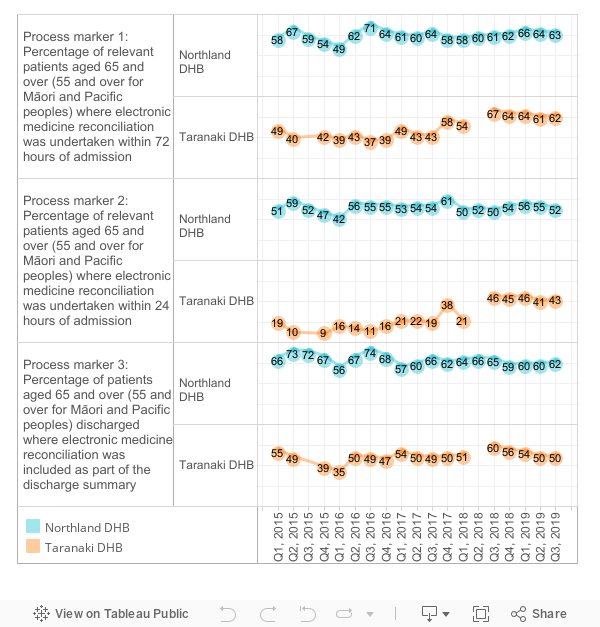
Within the six DHBs that have implemented eMedRec, only Northland and Taranaki DHB hospitals are reporting their process markers. Figure 22 shows the process marker change over time for these two DHBs. Further work is being undertaken on refining and agreeing the eMedRec marker definitions. Once this has been achieved the other DHB hospitals using eMedRec will report their process markers.
MS T 1
Patient deterioration
This is the sixth quarter that structural, process and outcome measures for the patient deterioration QSM have been reported. They are now presented as quarterly data rather than monthly data.
DHBs were asked to provide both process and outcome measure data by ethnicity where possible. Despite an increase in ethnicity data submitted since the previous quarter, we have not included this in the national report because the majority of DHBs were still unable to submit. We acknowledge that, for some DHBs, it will take more time to start collecting and submitting ethnicity-level data.
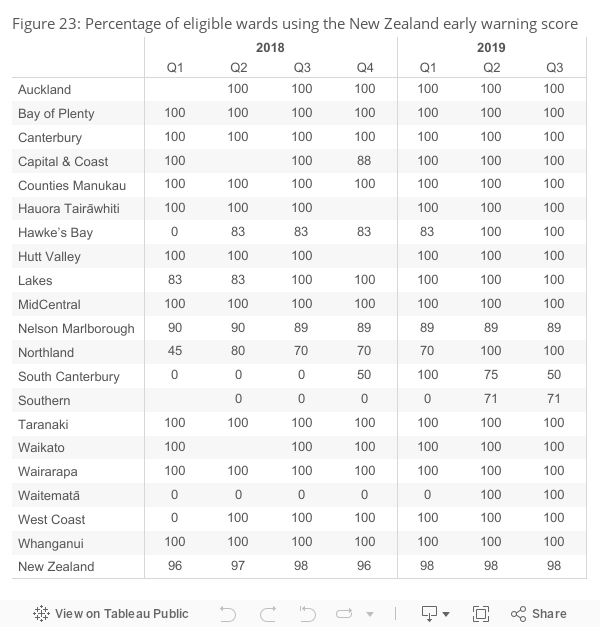
Structural measure: Eligible wards using the New Zealand early warning score
The structural measure demonstrates the progress DHBs have made towards implementing improvements to their recognition and response systems and aligning with the New Zealand early warning score (NZEWS).
All DHBs have now implemented or are in the process of implementing the NZEWS in their hospitals. We have also seen an increase in the use of the tool across all eligible wards from the last quarter (now at 98 percent). Note: the structure measure of national level is calculated based only on those DHBs that have implemented the NZEWS.
PD T 1
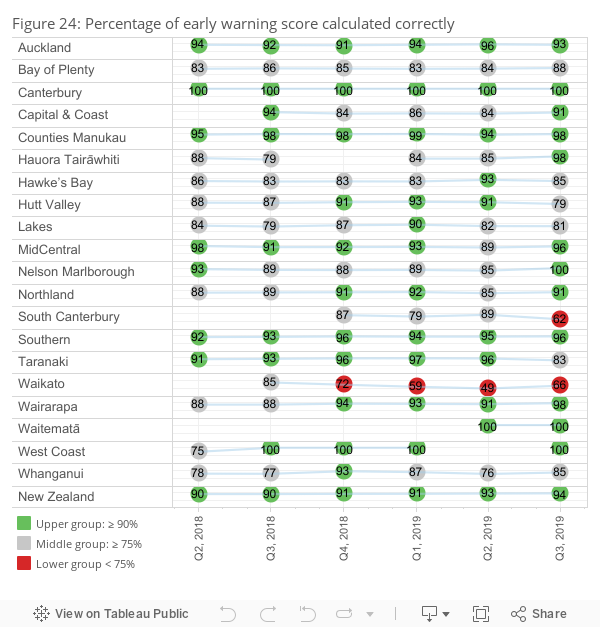
Process measure 1: Correct calculation of early warning score
The first process measure (Figure 24) shows the percentage of audited patients with an early warning score calculated correctly for the most recent set of vital signs. This measure demonstrates how the recognition part of the system is working through the correct use of the NZEWS. The national figure is 94 percent for this quarter, an increase from the previous quarter of 93 percent.
All DHBs submitted data for this measure. Those using an electronic vital signs system in all their eligible wards will be able to achieve 100 percent consistently for this measure.
PD T 2
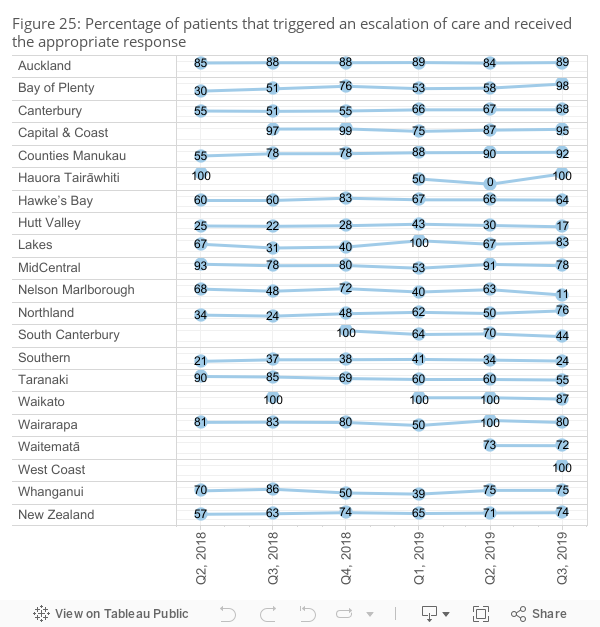
Process measure 2: Appropriate response to escalations
The second process measure (Figure 25) shows the percentage of audited patients that triggered an escalation of care and received the appropriate response to that escalation as per the DHB’s agreed escalation pathway. This measure demonstrates how the response part of the system is working through the appropriate response to care that has been escalated.
The national figure for this measure was 74 percent,an increase from the previous quarter of 71 percent. There was considerably more variation between DHBs than for the first process measure, highlighting an opportunity for improvement. The Commission is currently working with DHBs to understand this variation in particular regarding the consistency of data collected, the sample size and timeframes regarding the escalation pathway.
All DHBs submitted data for this measure.
PD T 3
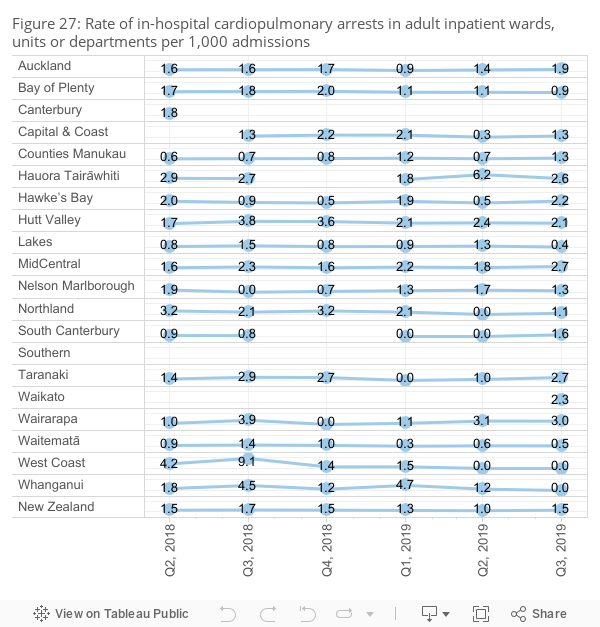
Outcome measure 1: Rate of in-hospital cardiopulmonary arrests (preliminary results)
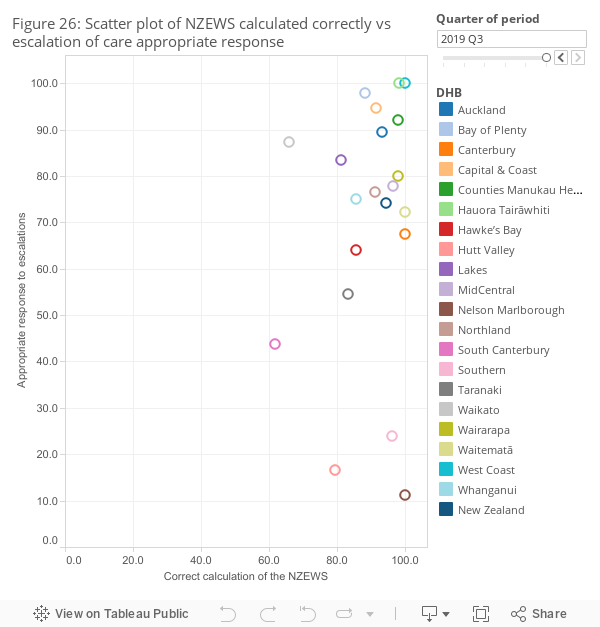
To further investigate the relationship between process measures 1 and 2, we have developed a scatterplot (Figure 26). The aim over time, is to have all DHBs locate in the top right corner, which reveals a high percentage of correct calculation of the NZEWS and appropriate response to escalations. It shows all DHBs had a high percentage of early warning score calculated correctly but there is more variation across all DHBs in the reported rates of appropriate response.
PD T 4
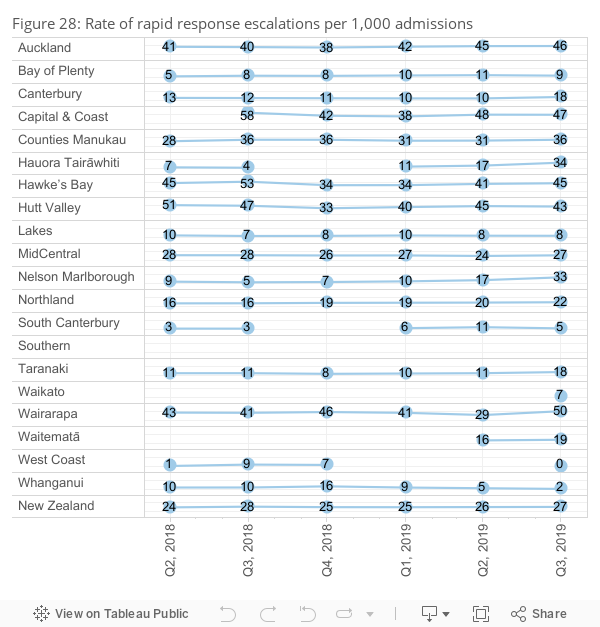
Outcome measure 2: Rate of rapid response escalations (preliminary results)
The following outcome measures will be used over time to determine whether the improvements to hospitals’ recognition and response systems have improved patient outcomes. Both measures are shown in a rate per 1,000 admissions. It is important to note that the admissions data used to calculate the rate is taken from the National Minimum Dataset (NMDS) at a DHB level and may differ from rates generated from administrative systems locally.
The results (Figure 27) show a national rate of 1.5 cardiopulmonary arrests per 1,000 admissions for this quarter.
Eighteen DHBs provided data for this measure.
PD T 5
The second outcome measure (Figure 28) shows the rate of rapid response escalations per 1,000 admissions (excluding those mentioned previously). Consistent with the previous quarter, the results showed a national rate of 27 events per 1,000 admissions. Nineteen DHBs (95 percent) provided data for this measure.
International research has shown that an effective recognition and response system will result in an inverse relationship between outcome measures 1 and 2 (ie, a higher rate of rapid response escalations with a lower rate of in-hospital cardiopulmonary arrests). Another outcome measure used internationally is unplanned admissions to intensive care units. See the patient deterioration domain of the Atlas of Healthcare Variation for related data.
PD T 6
Pressure injury
We aim to reduce the occurrence of and harm from pressure injuries (PIs). PIs (also known as pressure ulcers, decubitus ulcers, pressure areas and bed sores) are a cause of preventable harm for people using health care services, including hospital, aged residential care and home or community care.
PIs are often avoidable, have significant negative impact on patient’s lives, whānau, and those providing their care, increase hospital length of stay and are associated with extra resource consumption.
Following implementation of the PI QSM in July 2018, 19 of the 20 DHBs (95 percent) are now submitting data. This is the third quarter in which process and outcome measures have been reported publicly. Following a review of data this quarter we are planning to engage with DHBs to better understand local data collection processes.
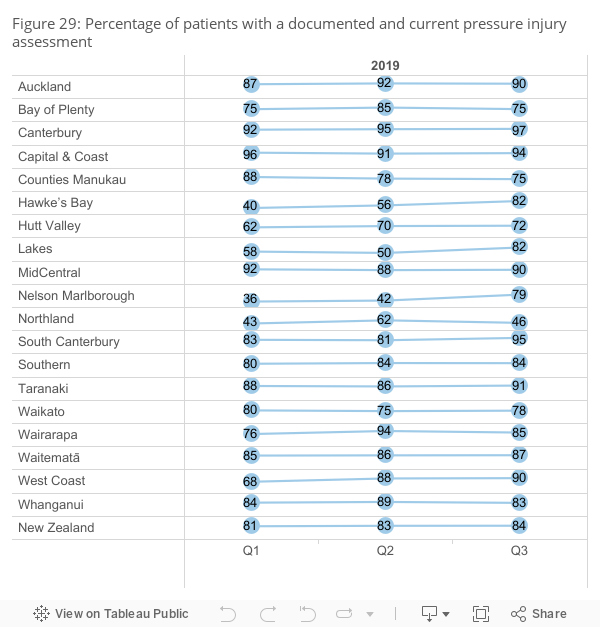
Process measure 1: percentage of patients with a documented and current pressure injury risk assessment
The first process measure (Figure 29) shows the percentage of patients with a documented and current PI risk assessment. This measure is used to monitor how well DHBs are conducting PI risk assessments and recognising at-risk patients. This includes those at risk of developing a PI and those with an existing PI.
Results for this measure revealed a national figure of 84 percent, an increase from 83 percent during last quarter.
PI T 1
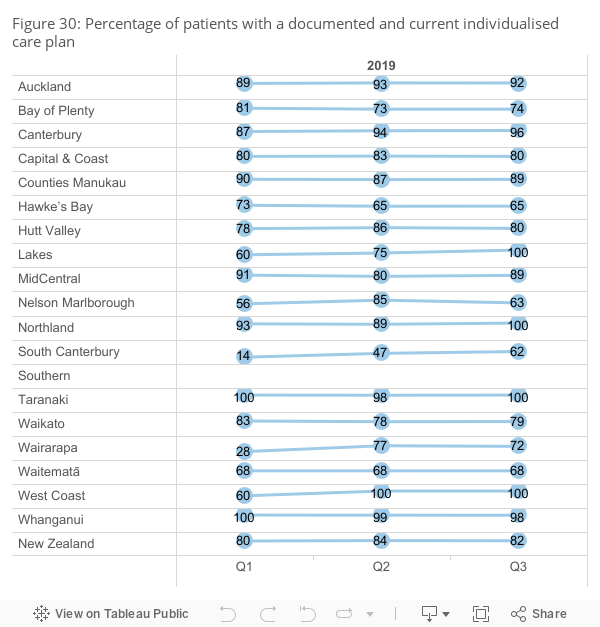
Process measure 2: Percentage of at-risk patients with a documented and current individualised care plan
The second process measure (Figure 30) shows the percentage of at-risk patients with a documented and current individualised care plan designed to address any risk (prevention) or manage any existing PIs. This measure is used to monitor how well DHBs are putting in actions to prevent or manage PIs for at-risk patients.
The national figure for this measure was a rate of 82 percent, a decrease from 84 percent during last quarter.
PS T 2
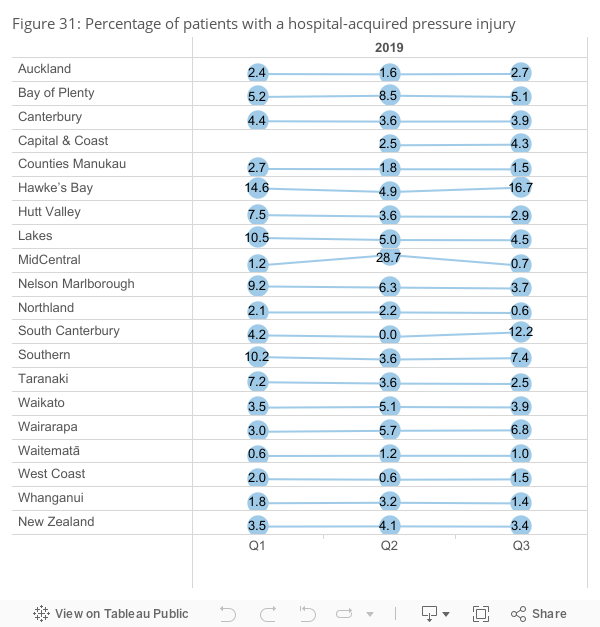
Outcome measure 1: Percentage of patients with hospital-acquired pressure injury
The following outcome measures will be used over time to determine whether the improvements to prevention and management of PIs have improved patient outcomes.
The first outcome measure (Figure 31) shows the percentage of patients with hospital acquired PIs (ie, PIs that formed while the patient was in hospital).
The national figure for this measure was a rate of 3.4 percent, a decrease from 4.1 percent during last quarter. There is also considerable variation between DHBs highlighting an opportunity for improvement. We are working with DHBs to improve consistency of data collection.
PS T 3
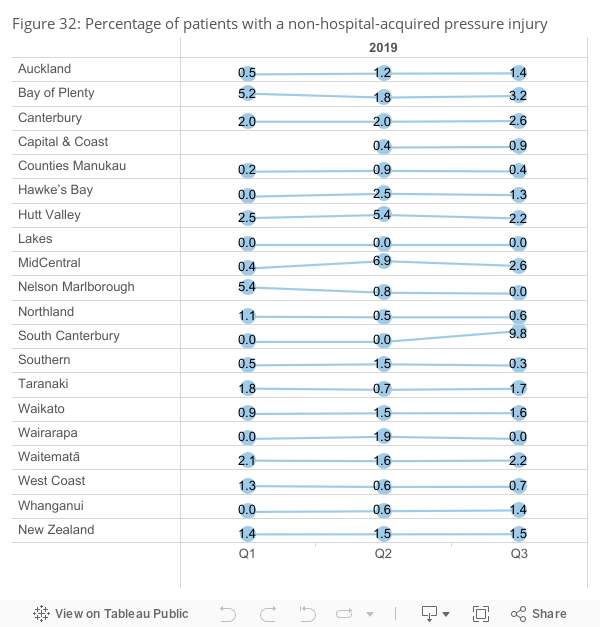
Outcome measure 2: Percentage of patients with a non-hospital-acquired pressure injury
The second outcome measure (Figure 32) shows the percentage of patients with non-hospital-acquired PIs (ie, patients that arrived at hospital with a PI that was formed in aged residential care, at home or in community care).
The national figure for this measure was a rate of 1.5 percent, consistent with last quarter. There is also considerable variation for this outcome measure highlighting an opportunity for improvement.
PS T 4
Safe use of opioids
This is the first report for the safe use of opioids QSM.
Opioid medicines (morphine, oxycodone, fentanyl, methadone, tramadol and codeine) are high-alert medicines, which are excellent at controlling pain but have a number of unintended side-effects (eg, constipation, nausea and vomiting, and urinary retention). Opioids can also cause serious harm when given in high doses, or in individuals who are at higher risk (eg, opioid-induced ventilatory impairment [OIVI] and cardiac arrest).
In response to these concerns, the Commission sponsored an 18-month formative collaborative from October 2014. The collaborative was aimed at building DHB and private hospital engagement and capacity to identify interventions to reduce opioid-related harm.
This work contributed to the development of a best-practice care bundle approach to decreasing opioid-related harm that includes interventions to reduce OIVI and opioid induced constipation (OIC).
Following the implementation of the opioid QSM in quarter 4, 2018, the majority of DHBs (75 percent; n=15) are now submitting data.
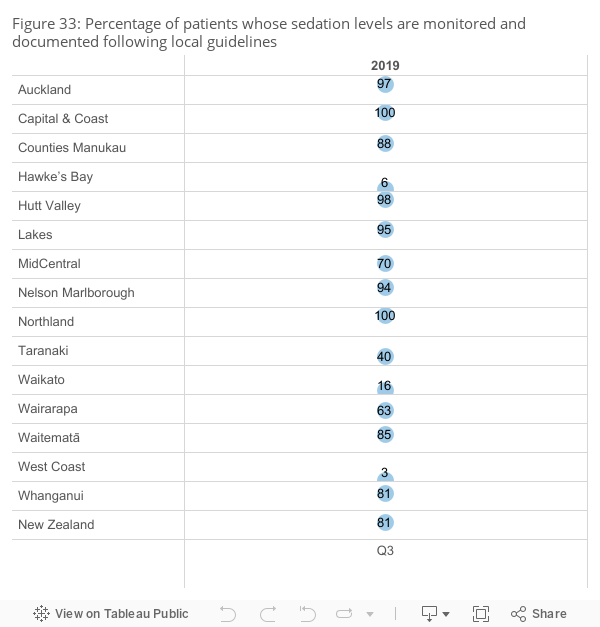
Process measure 1: Percentage of patients whose sedation levels are monitored and documented following local guidelines
Sedation levels are a marker for OIVI. The first process measure (Figure 33) shows the percentage of patients whose sedation levels are monitored and documented following local guidelines.
Results for this measure revealed a national figure of 81 percent of patients had their sedation scores monitored and documented.
A total of 15 DHBs (75 percent) submitted data for this measure.
Opioids T 1
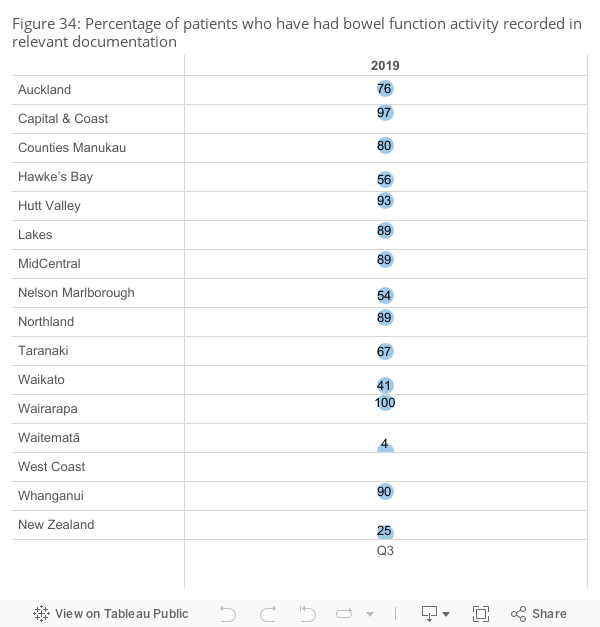
Process measure 2: Percentage of patients who have had bowel function activity recorded in relevant documentation
The second process measure (Figure 34) shows the percentage of patients who have had bowel function activity recorded, using the Bristol Stool Chart, in relevant documentation. Constipation is a common side-effect from the use of opioids; it can occur in 1 in 100 patients or more often.
The national figure for this measure was a rate of 25 percent. A total of 14 DHBs (70 percent) submitted data for this measure.
Opioids T 2
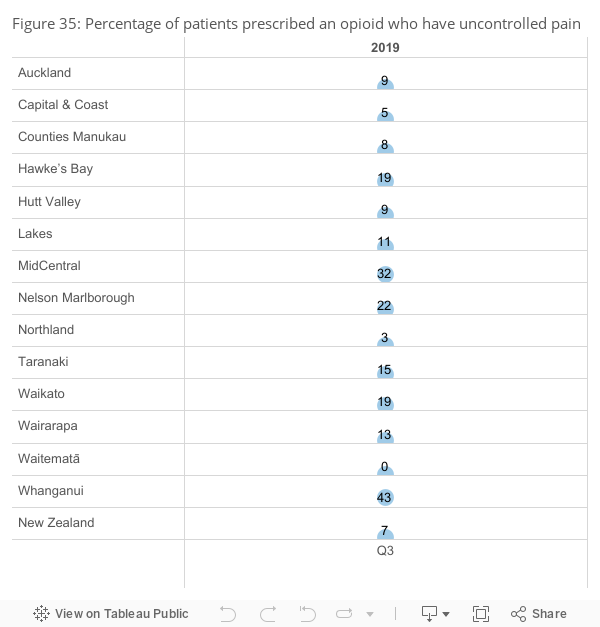
Balance measure: Percentage of patients prescribed an opioid who have uncontrolled pain
To avoid adverse effects from opioids, there is a risk that patients may have their pain under-treated, and so experience uncontrolled pain. A balance measure of 'patients prescribed an opioid who have uncontrolled pain' has therefore been included to monitor for any under-treatment of pain.
The balance measure (Figure 35) shows the percentage of patients prescribed an opioid who have uncontrolled pain. A low value for uncontrolled pain is desirable, that is, we do not want patients to experience uncontrolled pain.
The national figure for this measure was a rate of 7 percent, with 14 DHBs (70 percent) submitting data for this measure.
Opioids T 3
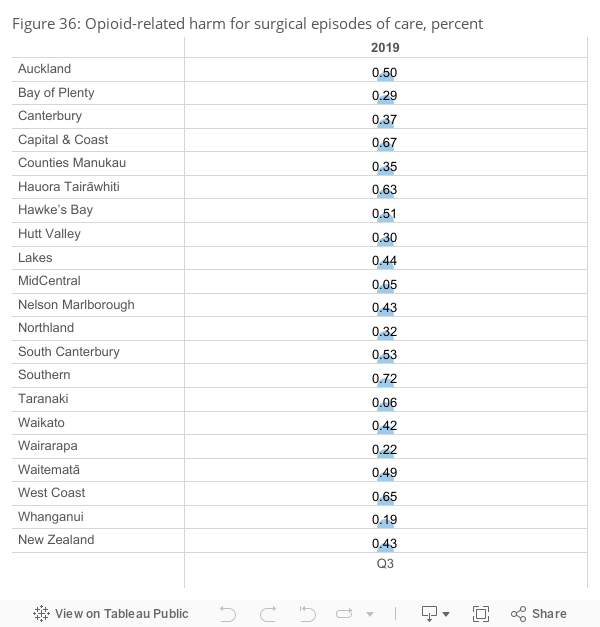
Outcome measure: Opioid-related harm for surgical episode of care [4]
The outcome measure is taken from the DHBs' NMDS data that is submitted to the Ministry of Health. The outcome measure will be used over time to determine whether the improvements to the monitoring and use of opioids improve patient outcomes through reduced harm.
The outcome measure (Figure 36) shows the percentage of surgical admission episodes with opioid-related harm. The national figure for this measure was a rate of 0.43 percent.
Please note: these outcome measures are not directly comparable between DHBs. The NMDS data is derived from DHB coding. While the coding practices within a DHB are standardised and sustainable, documentation and coding practices between DHBs may not be consistent. Therefore, the outcome measure must only be used to monitor changes over time within a single DHB.
Opioids T 4
References
- de Raad J–P. 2012. Towards a value proposition: scoping the cost of falls. Wellington: NZIER.
- Ibid.
- In quarter 1, 2015, 1.5 g or more of cefuroxime was accepted as an alternative agent to 2 g or more of cefazolin for routine antibiotic prophylaxis for hip and knee replacements. This improved the results of this process measure for MidCentral DHB significantly, from 10 percent before the change to 96 percent immediately after the change. It also increased the national result from 90 percent to 95 percent in quarter 1, 2015.
- A surgical episode of care. Opioid-related harm events are reported for all surgical patients in hospitals for the reporting quarter. Admissions to surgical services are treated as a single, continuous event or ‘episode of care’. Events are joined if they overlap. If an event end date is the same as an event start date, then the two events are joined. The episode start date is the first surgical admission starting date. The episode end date is the last event admission end date. So, if a patient is transferred between surgical wards for the same admission this is counted as a single episode of care.
Last updated: 9th December, 2021