The graphs below show a national decrease in seclusion rates in inpatient mental health units, including a substantial drop for Māori and Pacific peoples.
Seclusion is the practice of placing a person experiencing mental distress in a room from which they cannot freely exit. It is traumatic and harmful for the person, their whānau, visitors and health workers alike.
The Commission’s Zero seclusion: safety and dignity for all | Aukatia te noho punanga: noho haumanu, tū rangatira mō te tokomaha project team has worked in collaboration with district health boards (DHBs) to find alternatives to seclusion for people who are experiencing distress. The project began in 2019 and is now seeing the positive effects of decreased seclusion rates. Seclusion rates for Māori have recently been decreasing at a faster pace than for non-Māori non-Pacific, shrinking the equity gap between the two population groups.
Number of Māori secluded and admitted to inpatient mental health, Aotearoa New Zealand, 2019–21
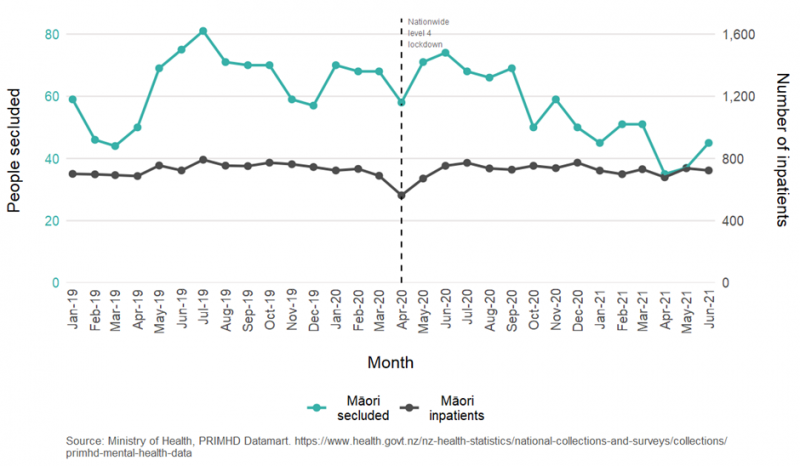
This figure compares the number of Māori admitted to inpatient mental health settings with the number of Māori secluded after admission, from January 2019 to June 2021. Note the different Y axes, as numbers of admissions are much greater than those of seclusions.
The figure shows the number of admissions of Māori to inpatient mental health facilities (charcoal line) was quite steady before April 2020. This number drops dramatically in April 2020, during the nationwide level 4 lockdown, before returning to a similar pattern. The number of people secluded (teal line) is more volatile, and has a similar dip during April 2020, resulting in the rate of seclusion per people admitted remaining steady. The number of people secluded has been steadily decreasing since June 2020.
Number of non-Māori, non-Pacific secluded and admitted to inpatient mental health, Aotearoa New Zealand, 2019‒21
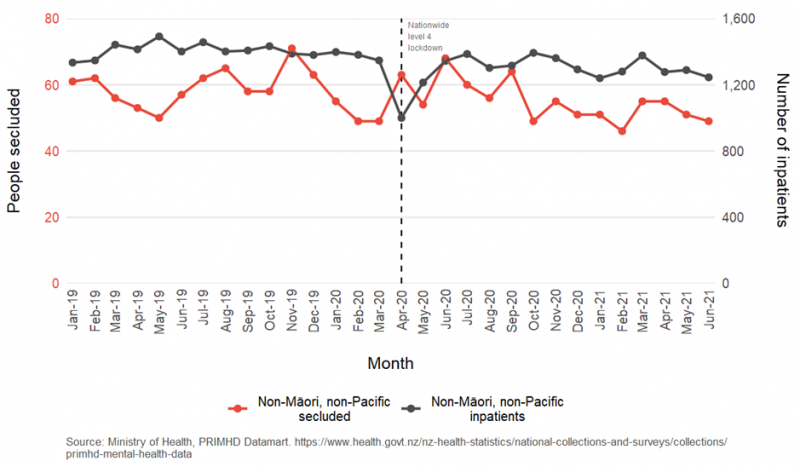
This figure compares the number of non-Māori, non-Pacific admitted to inpatient mental health settings with the number of non-Māori, non-Pacific who were secluded after admission, to see if there are any changes in patterns of seclusion from January 2019 to June 2021. Note the different Y axes, as numbers of admissions are much greater than those of seclusions.
The figure shows the number of admissions of non-Māori, non-Pacific people to inpatient mental health facilities (charcoal line) was steady before April 2020 (dotted line). This number drops dramatically in April 2020, during the nationwide level 4 lockdown, before returning to a similar pattern. The number of people secluded (red line) is more volatile, and remained at a similar level during April 2020, resulting in an increase in the rate of seclusion per people admitted. The number of seclusion events have decreased slightly since October 2020.
Number of Pacific peoples secluded and admitted to inpatient mental health, Aotearoa New Zealand, 2019 – 21
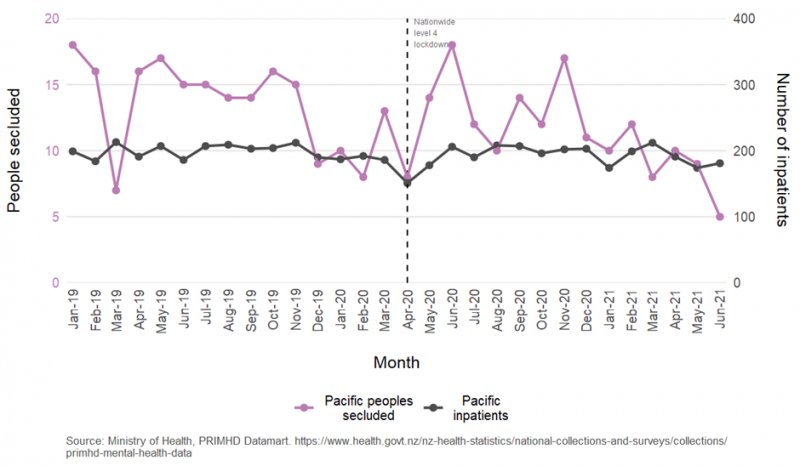
This figure compares the number of Pacific peoples admitted to inpatient mental health settings with the number of Pacific peoples who were secluded after admission, to see if there are any changes in patterns of seclusion from January 2019 to June 2021. Note the different Y axes, as numbers of admissions are much greater than those of seclusions.
The figure shows the number of admissions of Pacific peoples to inpatient mental health facilities (charcoal line) was steady before April 2020 (dotted line). This number drops in April 2020, during the nationwide level 4 lockdown, before returning to a similar pattern as before. The number of people secluded (purple line) is more volatile, and has a similar dip during April 2020, resulting in the rate of seclusion per people admitted remaining steady. The number of seclusion events have decreased since November 2020.
Rate of mental health inpatient secluded by ethnicity, Aotearoa New Zealand, 2019–21
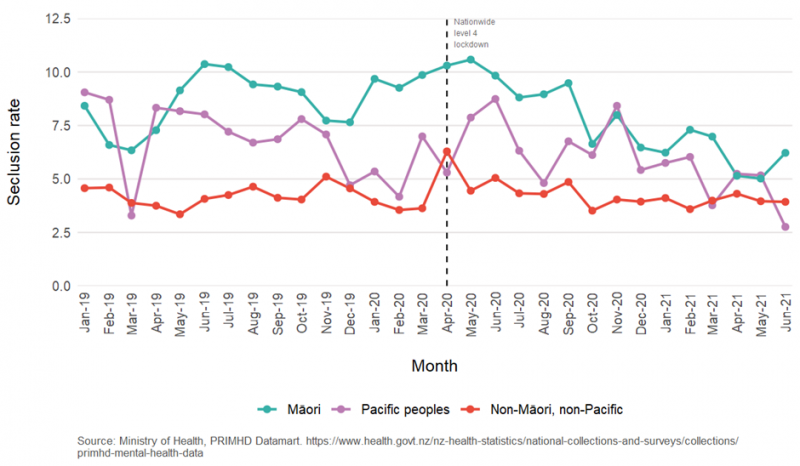
This figure compares the seclusion rate per people admitted to inpatient mental health facilities for Māori, non-Māori, non-Pacific, and Pacific peoples from January 2019 to June 2021.
The figure shows a higher rate of seclusion for Māori and Pacific peoples compared with non-Māori, non-Pacific. The seclusion rate for all groups appears to be decreasing since June 2020, with the decrease being markedly greater for Māori than for non-Māori, non-Pacific, shrinking the equity gap between the two groups.
Rate of Māori and non-Māori, non-Pacific mental health inpatients secluded, Aotearoa New Zealand, 2019–21
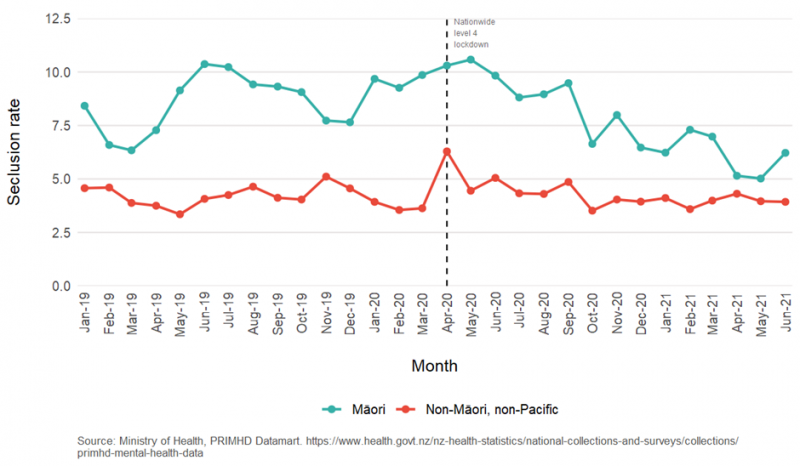
This figure compares the seclusion rate per people admitted to inpatient mental health facilities for Māori and non-Māori, non-Pacific from January 2019 to June 2021.
The figure shows a higher rate of seclusion for Māori (teal line) compared with non-Māori, non-Pacific (red line). The seclusion rate for non-Māori, non-Pacific was steady before April 2020 (dotted line). The seclusion rate increases sharply in April 2020, during the nationwide level 4 lockdown, driven by a decrease in the number of admissions, before returning to a similar pattern as before the lockdown. The seclusion rate for Māori shows a steady decrease since June 2020, shrinking the equity gap between the two groups.
Rate of Pacific and non-Māori, non-Pacific mental health inpatients secluded, Aotearoa New Zealand, 2019–21
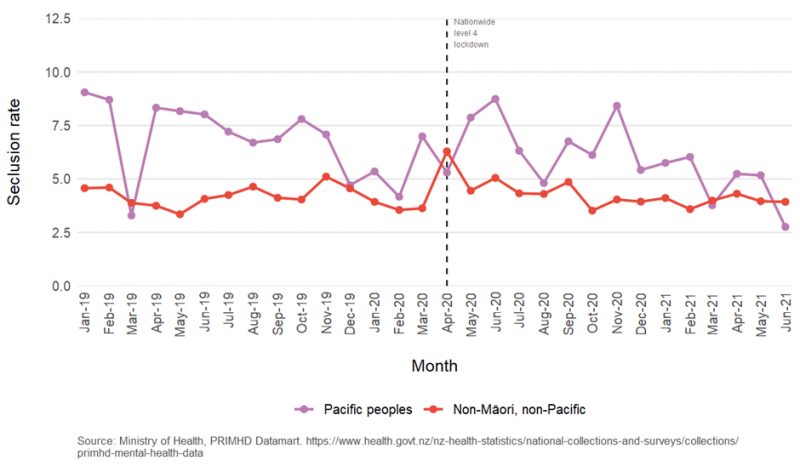
This figure compares the seclusion rate per people admitted to inpatient mental health facilities for Pacific peoples and non-Māori, non-Pacific from January 2019 to June 2021.
The figure shows a higher rate of seclusion for Pacific peoples (purple line) compared with non-Māori, non-Pacific (red line). The seclusion rate for non-Māori, non-Pacific was steady before April 2020 (dotted line). The seclusion rate increases sharply in April 2020, during the nationwide level 4 lockdown, driven by a decrease in the number of admissions, before returning to a similar pattern as before the lockdown. The seclusion rate for Pacific peoples appears to be decreasing since February 2021.
More information
For more information on the Commission’s zero seclusion project, please visit our website: