You can download the full April–June 2020 QSM results (1.7MB, PDF) or view the commentary and interactive charts below.
Note on change to reporting due to COVID-19
In response to the COVID-19 pandemic, the Health Quality & Safety Commission temporarily suspended the requirement for district health boards (DHBs) to report on manually collected quality and safety marker (QSM) measures from 23 March 2020 until 30 June 2020.
For example, falls risk assessment and care planning for the falls QSM and number of cardiac arrests for the patient deterioration QSM.
We also extended the date for submitting data for all surgical site infection (SSI) process and outcome measures to 30 June 2020.
During this period, we continued to monitor and publish outcome measures where data is obtained from the National Minimum Dataset (NMDS), for example, falls with a fractured neck of femur.
The measures that published in the reports for the January–March and April–June 2020 quarters are:
- outcome measures sourced from the NMDS
- hand hygiene – both the five moments for hand hygiene and Staphylococcus aureus bacteraemia (SAB) measures
- SSIs up to the end of March 2020.
In the local DHB report only, we will publish data for other measures submitted for the January–March and April–June 2020 quarters. The markers affected are: electronic medicine reconciliation; falls; patient deterioration; pressure injury; and safe use of opioids. This is not aggregated to make a New Zealand total; it is only displayed for the DHBs that submitted data.
From 1 July 2020, we expect DHBs to have started collecting for all QSM measures and to submit this data on 6 November 2020.
DHBs are expected to start collecting data for the consumer engagement QSM in December 2020 and provide an initial report in June 2021.
The above dates may change in response to the COVID-19 pandemic.
Local DHB report
Falls
Process marker 1: Percentage of older people assessed for the risk of falling
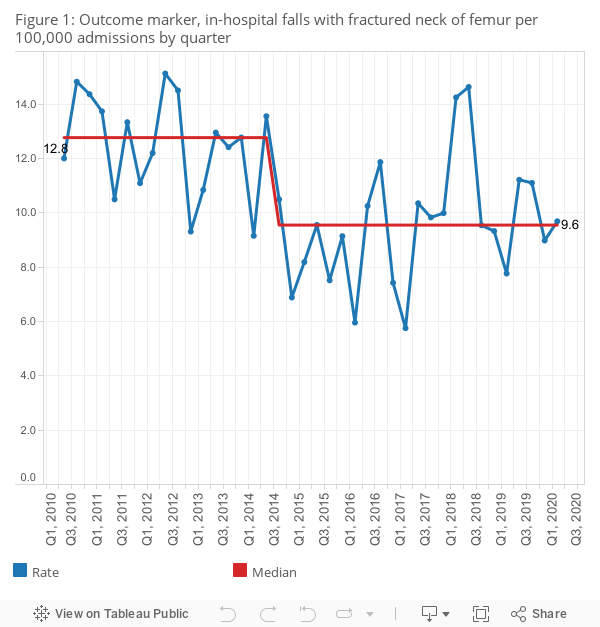
There were 92 falls resulting in a fractured neck of femur (broken hip) in the 12 months ending June 2020.
Figure 1 shows the quarterly rate of in-hospital falls causing a fractured neck of femur per 100,000 admissions.
The median of this measure was 12.8 in the baseline period of July 2010 to June 2012. It had moved down since September 2014 to 9.6 per 100,000 admissions – a significant improvement. This reduction is supported by the observed improvement in the assessment and plan process marker results. There has been some variation since the shift, particularly from 2018. The peak showed in Figure 1 in quarters 1 and 2, 2018 can be explained by a slight increase in the number of falls across several DHBs.
Falls T 1
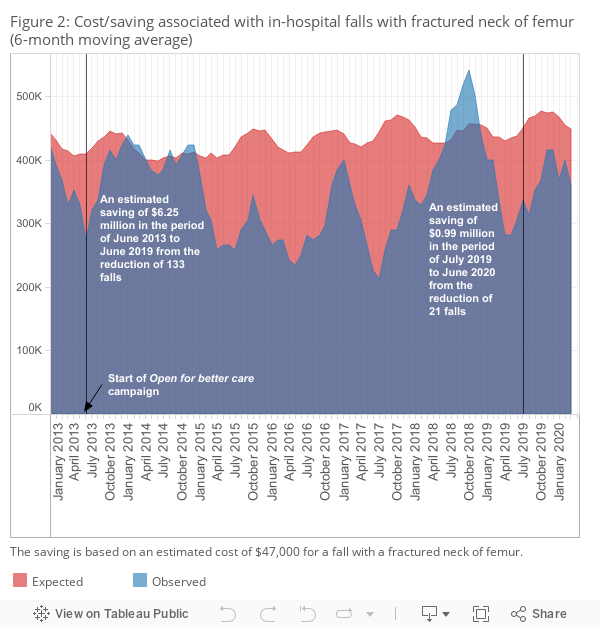
The number of 92 in-hospital falls resulting in a fractured neck of femur is significantly lower than the 113 we would have expected in the last 12 months, given the falls rate observed in the period between July 2010 and June 2012. The in-hospital falls reduction is estimated to have saved $0.99 million from July 2019 up until June 2020. This is based on an estimate of $47,000[1] for a fall with a fractured neck of femur (Figure 2). Savings of $7.25 million have been made since the Commission’s reducing harm from falls programme began.
We know some of these patients are likely to be admitted to aged residential care on discharge from hospital, which is estimated to cost $135,000 per occurrence.[2]
If we conservatively estimate that 20 percent of the patients who avoided a fall-related fractured neck of femur would have been admitted to an aged residential care facility, the reduction in falls represents $1.36 million in total avoidable costs since July 2019.
Falls T 2
Hand hygiene
Despite the increased workload with COVID-19, the DHB infection prevention and control (IPC) and hand hygiene teams remained committed to having excellent hand hygiene practice throughout their DHB to prevent the spread of COVID-19 in hospitals.
In March–June 2020, national compliance with the five moments for hand hygiene was recorded at 87 percent. This is the highest result for this measure since the hand hygiene programme began, when it was 62 percent (July–October 2012).
HH T 1
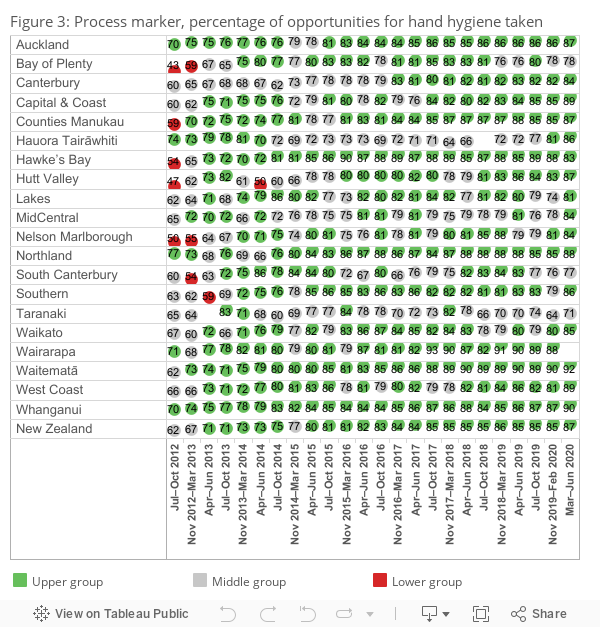
- Upper group: ≥ 70 percent before quarter 3, 2014, 75 percent in quarters 3 and 4, 2014, and 80 percent since quarter 1, 2015.
- Middle group: 60 percent to target.
- Lower group: < 60 percent.
- Hand hygiene national compliance data is reported three times every year, not quarterly.
- The reporting periods for hand hygiene data have changed slightly as of November 2019. The reports now cover equal four-monthly periods.
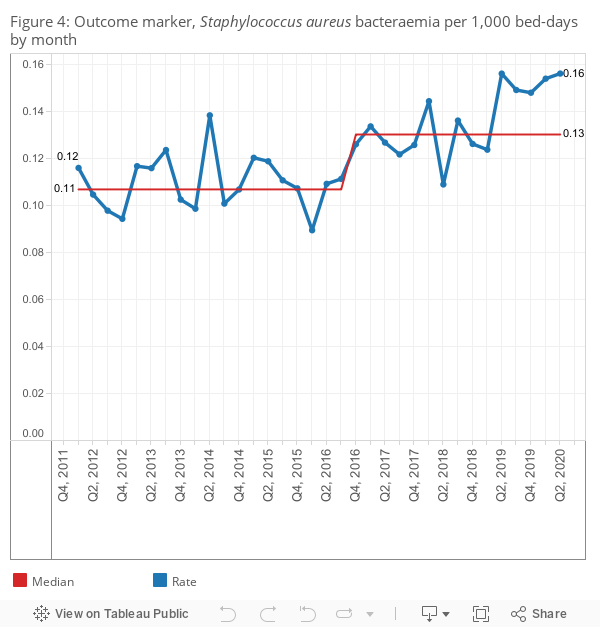
Outcome marker: Healthcare associated Staphylococcus aureus bacteraemia (SAB) per 1,000 bed-days
Healthcare associated SAB can be associated with medical devices or surgical procedures, which means the onset of symptoms may occur outside of the hospital (community onset).
Figure 4 displays the quarterly healthcare associated SAB per 1,000 bed-days. The quarterly rate has been consistently high since quarter 2, 2019. The Commission will be working with DHBs over the next year to collect the source of SAB cases, such as central lines, peripheral lines and surgical procedures. This data will help to identify potential areas for improvement.
HH T 2
Surgical site infection improvement (SSII) – orthopaedic surgery
As the Commission uses a 90-day outcome measure for surgical site infection (SSI), the data runs one quarter behind other measures. Information in this section relates to hip and knee arthroplasty procedures from quarter 3, 2013 to quarter 1, 2020.
Process marker 1: Antibiotic administered in the right time
For primary procedures, an antibiotic should be administered in the hour before the first incision (‘knife to skin’). As this should happen in all primary cases, the threshold is set at 100 percent. In quarter 1, 2020, 98 percent of hip and knee arthroplasty procedures involved the giving of an antibiotic within 60 minutes before knife to skin. Seven DHBs achieved the national goal. Capital & Coast has achieved 100 percent for all of the last seven quarters.
SSII - OS T 1
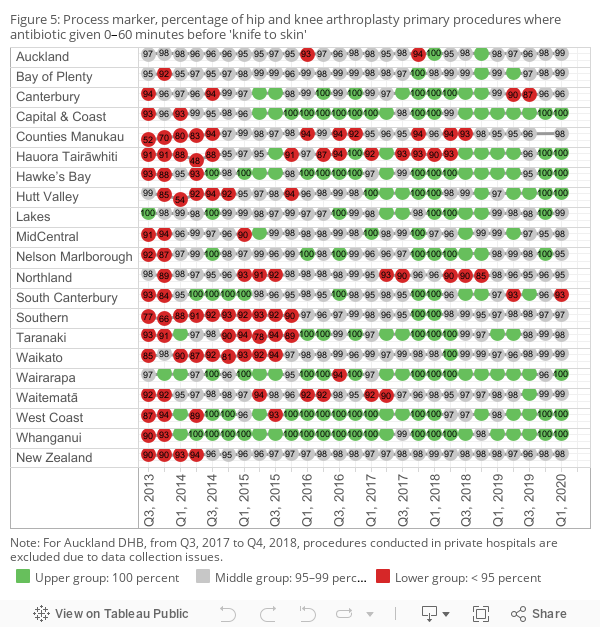
- Upper group: 100 percent
- Middle group: 95–99 percent
- Lower group: < 95 percent
Process marker 2: Right antibiotic in the right dose – cefazolin 2 g or more or cefuroxime 1.5 g or more
In the current quarter, 97 percent of hip and knee arthroplasty procedures received the recommended antibiotic and dose. Fifteen of the 20 DHBs reached the threshold level of 95 percent compared with only three in the baseline quarter.[3] Twelve DHBs reached the threshold level for at least the move recent six quarters.
SSII - OS T 2
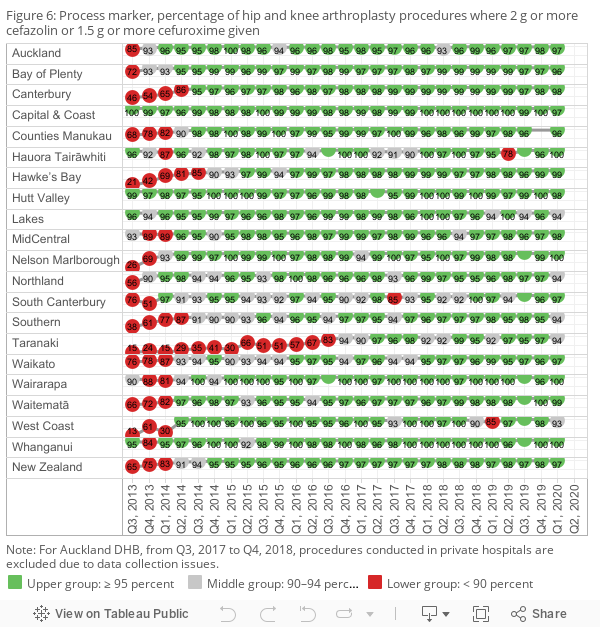
- Upper group: ≥ 95 percent
- Middle group: 90–94 percent
- Lower group: < 90 percent
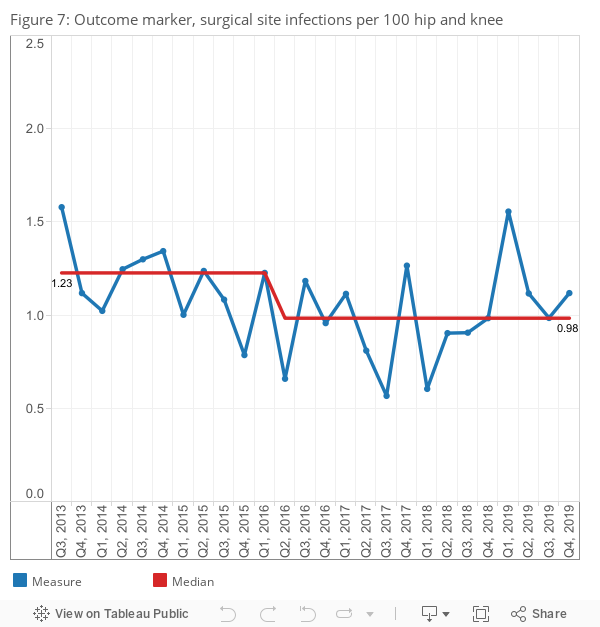
Outcome marker: SSIs per 100 hip and knee operations
In quarter 1, 2020, there were 23 SSIs out of 2,152 hip and knee arthroplasty procedures, a quarterly SSI rate of 1.1 percent, which is higher than the current median of 0.98 percent since August 2015.
SSII - OS T 3
Surgical site infection improvement (SSII) – cardiac surgery
There are three process markers and one outcome marker, which are similar to the markers for orthopaedic surgery.
Process marker 1: Timing – an antibiotic to be given 0–60 minutes before knife to skin
The target is for 100 percent of procedures to achieve this marker. Only Southern DHB met the target this quarter.
SSII - SC T 1
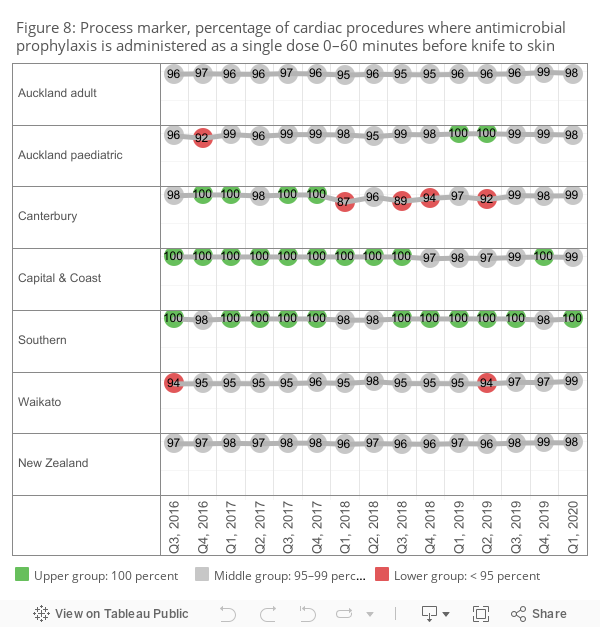
- Upper group: 100 percent
- Middle group: 95–99 percent
- Lower group: < 95 percent
Process marker 2: Dosing – correct antimicrobial prophylaxis used in at least 95 percent of procedures
The antibiotic prophylaxis of choice is ≥ 2 g or more of cefazolin for adults and ≥ 30 mg/kg of cefazolin for paediatric patients, not to exceed the adult dose. The target is that either dose is used in at least 95 percent of procedures. All DHBs performing cardiac surgery except Southern DHB achieved the target this quarter. Auckland adult and Capital & Coast have consistently reached the threshold since the beginning of the programme.
SSII SC T 2
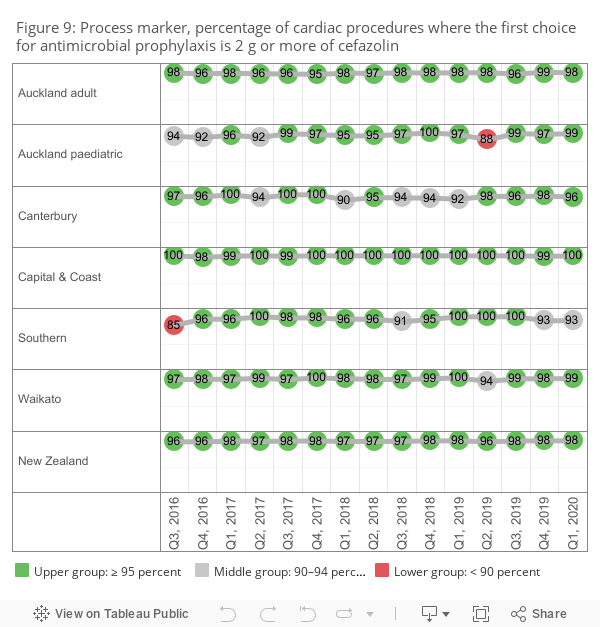
- Upper group: > 95 percent
- Middle group: 90-95 percent
- Lower group: < 90 percent
Process marker 3: Skin preparation – appropriate skin antisepsis is always used
Appropriate skin antisepsis in surgery involves alcohol/chlorhexidine or alcohol/povidone iodine. The target is 100 percent of procedures achieving this marker. All DHBs performing cardiac surgery except Southern DHB achieved the target this quarter. Auckland paediatric, Canterbury and Capital & Coast have all achieved 100 percent for the last seven quarters.
SSII SC T 3
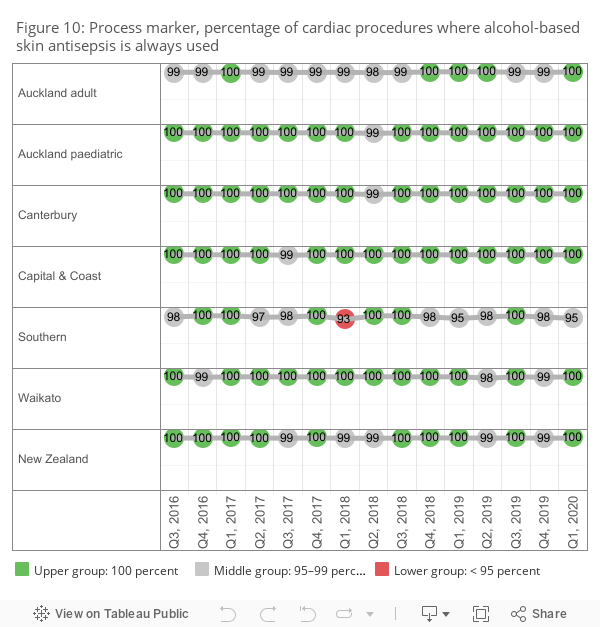
- Upper group: 100 percent
- Middle group: 95–99 percent
- Lower group: < 95 percent
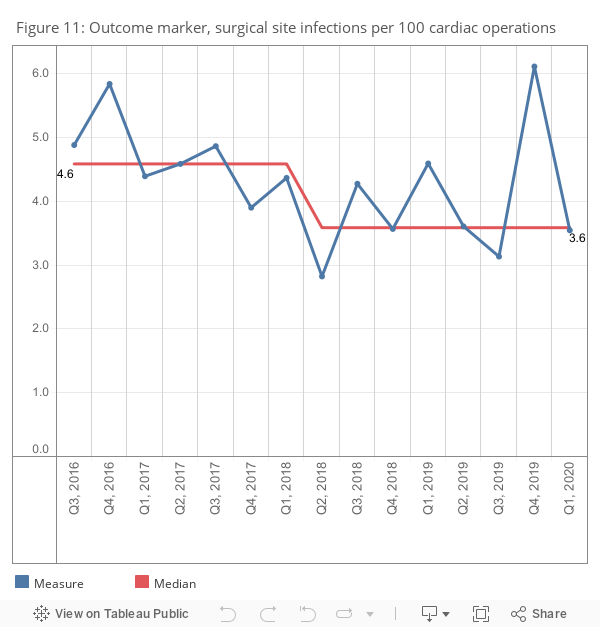
Outcome marker: SSIs per 100 procedures rate
In quarter 1, 2020, the rate of SSI cases per 100 cardiac procedures reduced from 6.1, its highest point ever, to 3.5. We will work closely with DHBs to understand the cause of the high point. In March 2018 the median shifted downwards from 4.6 SSI cases per 100 cardiac procedures to 3.6. This is a significant improvement since the beginning of the SSII programme. Cardiac surgical services in DHBs are dedicated to achieving high compliance with the process measures and implementing other quality improvement activities such as an anti-staphylococcal bundle.
SSII SC T 4
Safe surgery
The safe surgery QSM measures levels of teamwork and communication relating to the paperless surgical safety checklist.
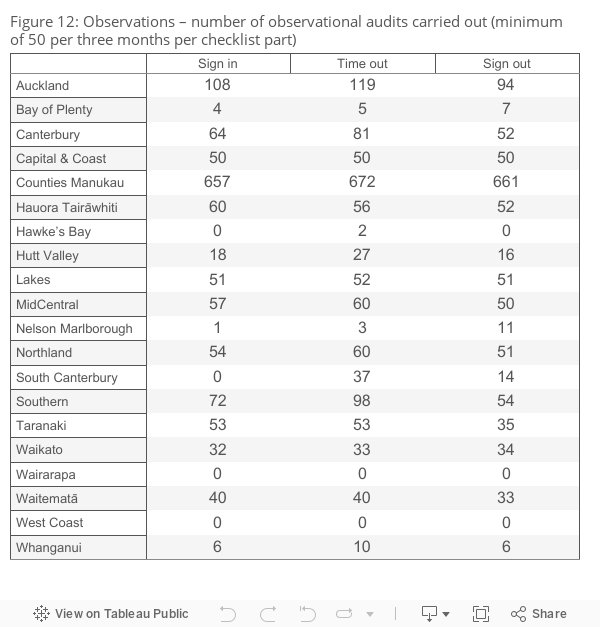
Direct observational audit was used to assess the use of the three surgical checklist parts: sign in, time out and sign out. A minimum of 50 observational audits per quarter per part is required before the observation is included in uptake and engagement assessments.
Figure 12 shows how many audits were undertaken for each part of the checklist. In quarter 2, 2020, the minimum of 50 observational audits carried out has not been separately colour-coded due to lower numbers of audits completed during COVID-19 restrictions.
SS T 1
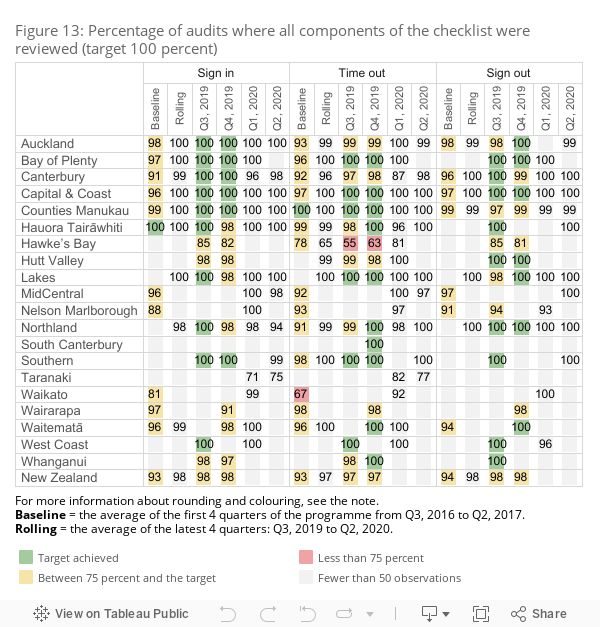
Rates for uptake (all components of the checklist were reviewed by the surgical team) are only presented where at least 50 audits were undertaken for a checklist part. Uptake rates were calculated by measuring the number of audits of a part where all components of the checklist were reviewed against the total number of audits undertaken.
The components for each part of the checklist are shown in the poster on the right. During to COVID-19 restrictions, lower numbers of audits were completed. As a result, no targets are displayed. Data is not presented where there were fewer than 50 audits.
SS T 2
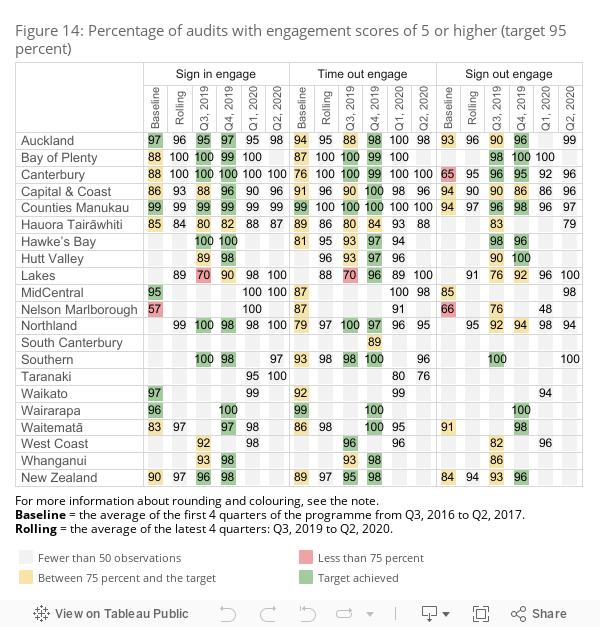
The levels of team engagement with each part of the checklist were scored using a seven-point Likert scale developed by the World Health Organization. A score of 1 represents poor engagement from the team and 7 means team engagement was excellent. The target is that 95 percent of surgical procedures score engagement levels of 5 or above. During COVID-19 restrictions, lower numbers of audits were completed. As a result, no targets are displayed. Data is not presented where there were fewer than 50 audits.
SS T 3
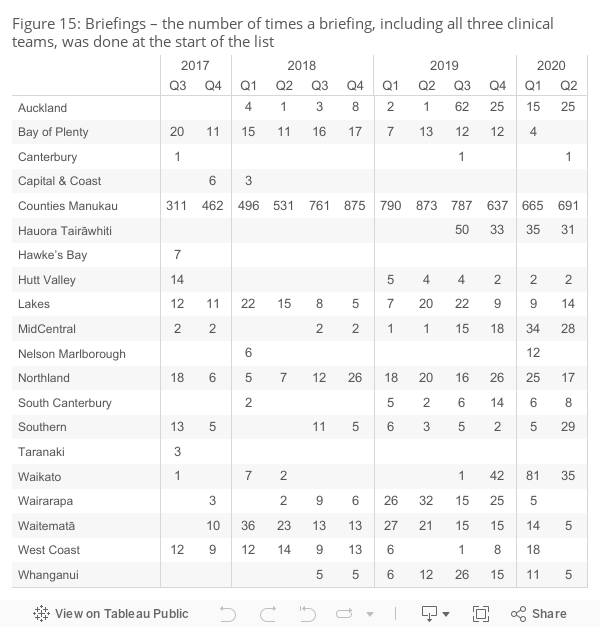
The safe surgery quality and safety domain includes a start-of-list briefing measure to reinforce the importance of the briefing as a safe surgery intervention. The measure is described as, ‘Was a briefing including all three clinical teams done at the start of the list?’ There is no specific target for this part of the measure; the aim is to have all 20 DHBs increasingly undertaking and reporting briefings over time.
Figure 15 shows, in quarter 2, 2020, 13 DHBs reported that a start-of-list briefing was happening. There has been a general increase observed over time. The Safe Surgery NZ programme team continues to work with DHB auditing teams to promote briefings and improve data submission so the report better matches practice in DHBs.
SS T 4
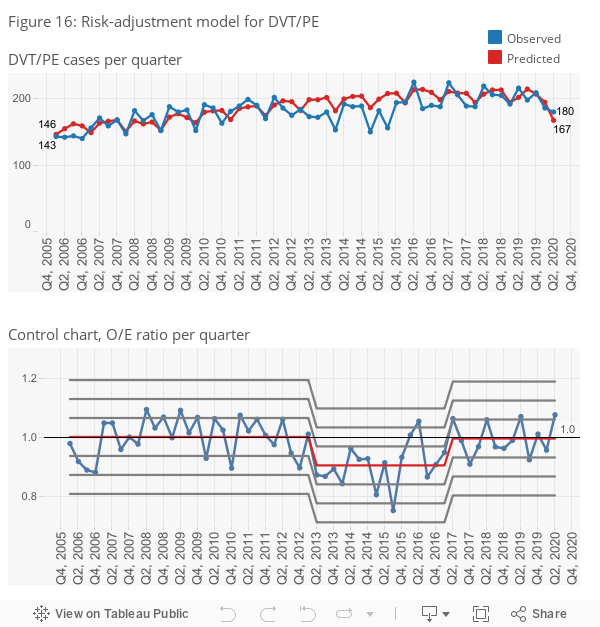
The rates of postoperative deep vein thrombosis/pulmonary embolism (DVT/PE) is the outcome marker for safe surgery. Rates have fluctuated over time. To understand the factors driving the changes and to provide risk-adjusted outcomes in the monitoring and improvement of surgical QSMs, we have developed a risk-adjustment model for this outcome marker.
The model identifies how likely patients being operated on were to develop DVT/PE based on factors such as their condition, health history and the operation being undertaken. From this, we calculated how many patients would be predicted to develop DVT/PE based on historic trends. We then compared how many patients actually developed DVT/PE to create an observed/expected (O/E) ratio. If the O/E ratio is more than 1 then there are more DVT/PE cases than expected, even when patient risk is taken into account. A ratio of less than 1 indicates fewer DVT/PE cases than expected.
Figure 16 shows the DVT/PE risk-adjustment model results in two charts. The O/E ratio control chart shows there were 11 consecutive quarters in which the observed numbers were below the expected numbers since quarter 2, 2013. This indicates a statistically significant downwards shift, taking into account the increasing number of high-risk patients treated by hospitals and more complex procedures undertaken by hospitals. Over the past four years, a higher number of cases of DVT/PE have been observed in the second quarter.
SS T 5
Medication safety – electronic medicine reconciliation
This quality and safety domain focuses on medicine reconciliation where the process is supported with electronic data capture. Medicine reconciliation is a process by which health professionals accurately document all medicines a patient is taking and their adverse reactions history (including allergy). The information is then used during the patient’s transitions in care. An accurate medicines list can be reviewed to check the medicines are appropriate and safe. Medicines that should be continued, stopped or temporarily stopped can be documented on the list. Reconciliation reduces the risk of medicines being:
- omitted
- prescribed at the wrong dose
- prescribed to a patient who is allergic
- prescribed when they have the potential to interact with other prescribed medicines.
The introduction of electronic medicine reconciliation (eMedRec) allows reconciliation to be done more routinely, including at discharge. There is a national programme to roll out eMedRec throughout the country. Figures 20 and 21 show there are six DHBs that have implemented the system to date. Further uptake of eMedRec is limited until the IT infrastructure is improved in each DHB hospital.
Figure 17: Structure marker, implementation of eMedRec
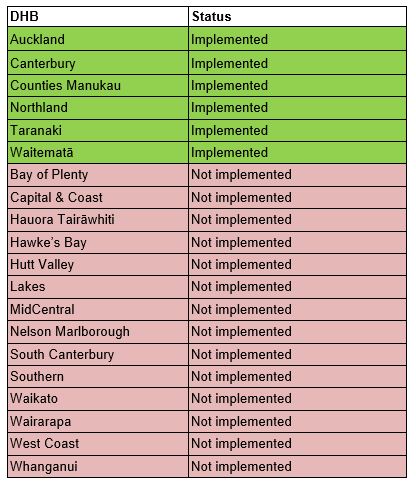
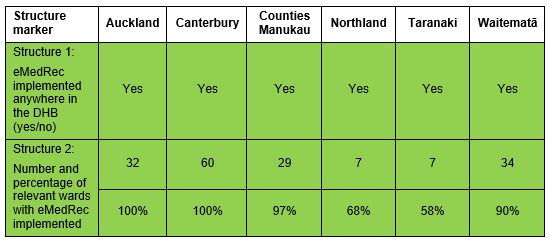
Figure 18: Structure markers, eMedRec implementation
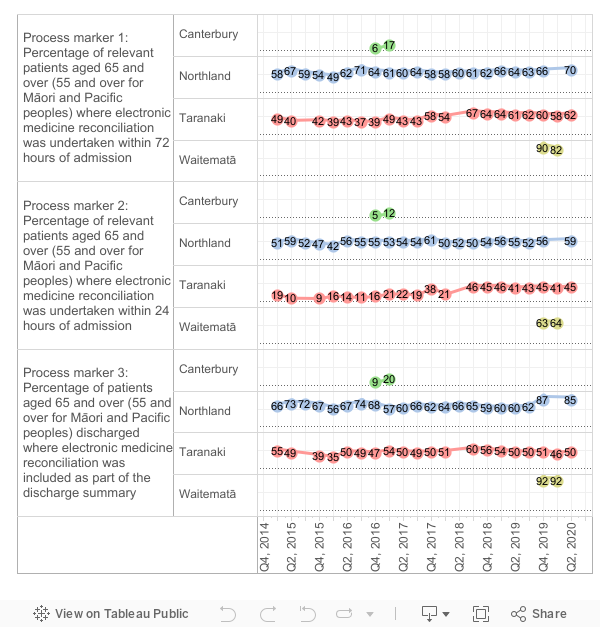
Within the six DHBs that have implemented eMedRec, only Northland, Taranaki and Waitematā DHB hospitals are reporting their process markers. Figure 22 shows the process marker change over time for Northland and Taranaki DHBs. Further work is being undertaken on refining and agreeing the eMedRec marker definitions. Once this has been achieved the other DHB hospitals using eMedRec will report their process markers.
MS T 1
Safe use of opioids
This is the fourth time we have reported the safe use of opioids QSM.
Opioid medicines (morphine, oxycodone, fentanyl, methadone, tramadol and codeine) are high-alert medicines, which are excellent at controlling pain but have a number of unintended side-effects (eg, constipation, nausea and vomiting, and urinary retention). Opioids can also cause serious harm when given in high doses, or in individuals who are at higher risk (eg, opioid-induced ventilatory impairment [OIVI] and cardiac arrest).
In response to these concerns, the Commission sponsored an 18-month formative collaborative from October 2014. The collaborative was aimed at building DHB and private hospital engagement and capacity to identify interventions to reduce opioid-related harm.
This work contributed to the development of a best-practice care bundle approach to decreasing opioid-related harm that includes interventions to reduce OIVI and opioid-induced constipation.
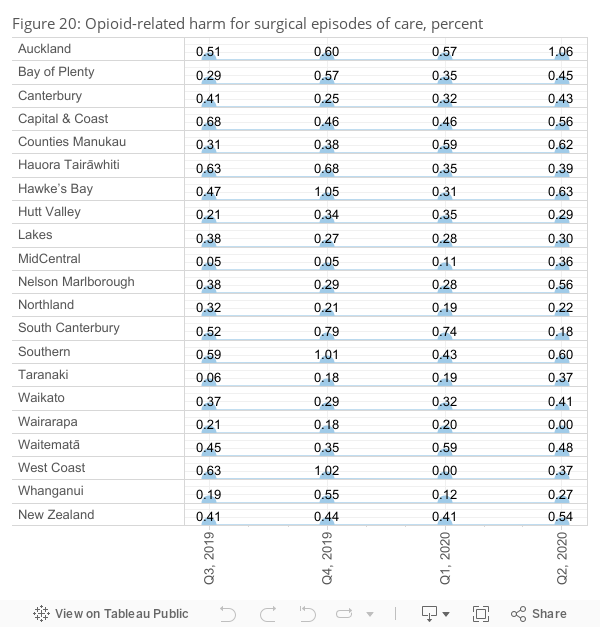
Outcome measure: Opioid-related harm for surgical episode of care [4]
The outcome measure is taken from DHB NMDS data submitted to the Ministry of Health. The measure will be used over time to determine whether improvements to the monitoring and use of opioids improve patient outcomes through reduced harm.
Figure 20 shows the percentage of surgical admission episodes with opioid-related harm. The national figure for this measure was a rate of 0.54 percent.
Please note this outcome measure is not directly comparable between DHBs. The NMDS data is derived from DHB coding. While the coding practices within a DHB are standardised and sustainable, documentation and coding practices between DHBs may not be consistent. Therefore, the outcome measure must only be used to monitor changes over time within a single DHB.
Opioids T 1
References
- de Raad J–P. 2012. Towards a value proposition: scoping the cost of falls. Wellington: NZIER.
- Ibid.
- In quarter 1, 2015, 1.5 g or more of cefuroxime was accepted as an alternative agent to 2 g or more of cefazolin for routine antibiotic prophylaxis for hip and knee replacements. This improved the results of this process measure for MidCentral DHB significantly, from 10 percent before the change to 96 percent immediately after the change. It also increased the national result from 90 percent to 95 percent in quarter 1, 2015.
- A surgical episode of care. Opioid-related harm events are reported for all surgical patients in hospitals for the reporting quarter. Admissions to surgical services are treated as a single, continuous event or ‘episode of care’. Events are joined if they overlap. If an event end date is the same as an event start date, then the two events are joined. The episode start date is the first surgical admission starting date. The episode end date is the last event admission end date. So, if a patient is transferred between surgical wards for the same admission this is counted as a single episode of care.
Published: 1 Nov 2021
Modified: 22 Dec 2021